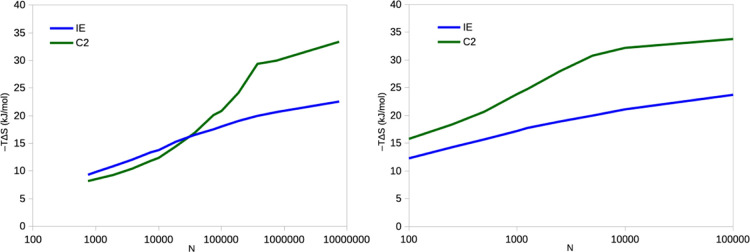
Figure 9.
Entropies estimated by the IE and C2 methods for the binding of phenol to ferritin, estimated from 10 × 10 ns simulations with a sampling frequency of 10 fs (left) and 10 × 100 ns simulations with a sampling of 10 ps (right). In both cases, the simulations are then divided into batches of different sizes. Note the logarithmic scale on the x-axis.

