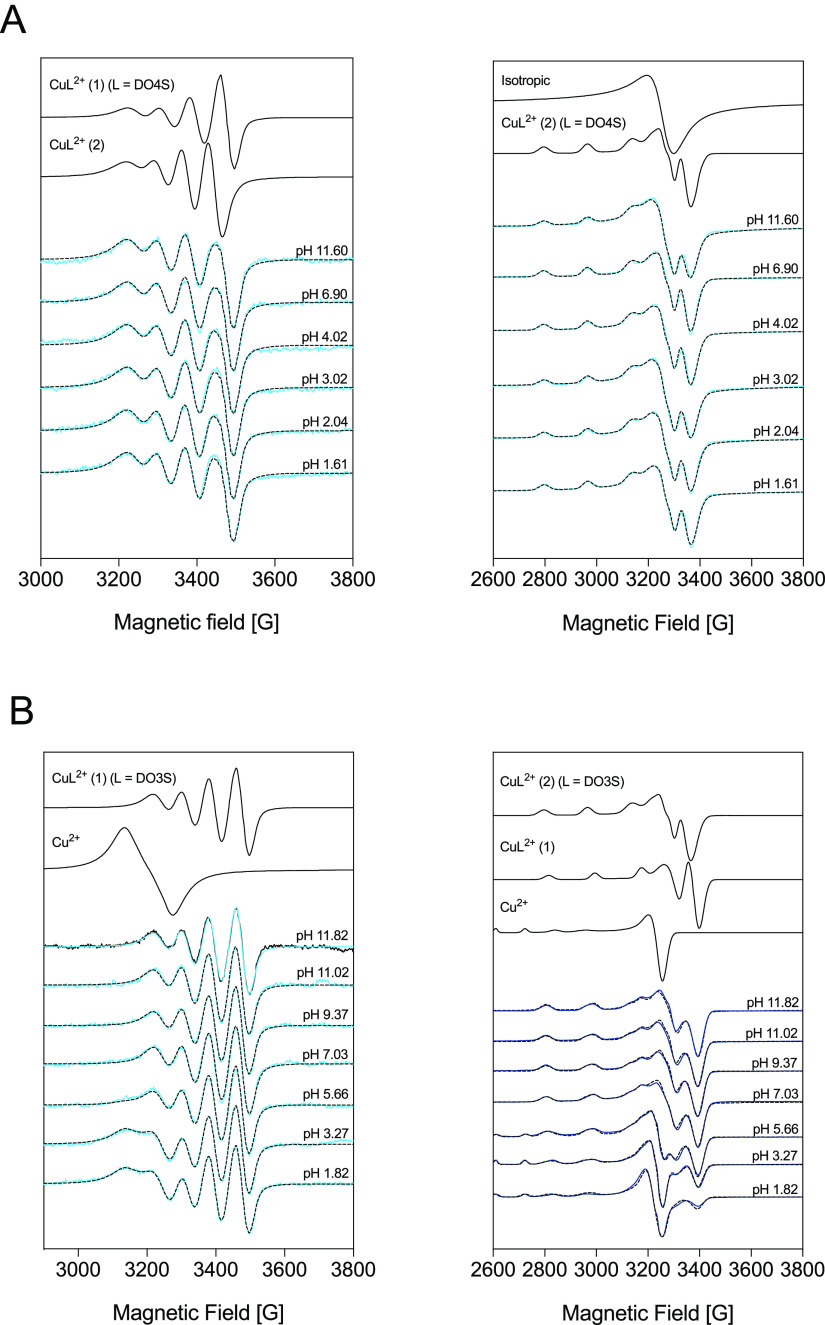
Figure 4.
Measured (solid lines) and simulated (dotted lines) EPR spectra for solutions containing Cu2+ and (A) DO4S (CCu2+ = 1.0 × 10⁻³ mol/L; CDO4S = 1.3 × 10⁻³ mol/L) and (B) DO3S (CCu2+ = 1.0 × 10⁻³ mol/L; CDO3S = 1.1 × 10⁻³ mol/L) at room temperature (left) and 77 K (right). The component spectra obtained from the simulation are shown in the upper part.

