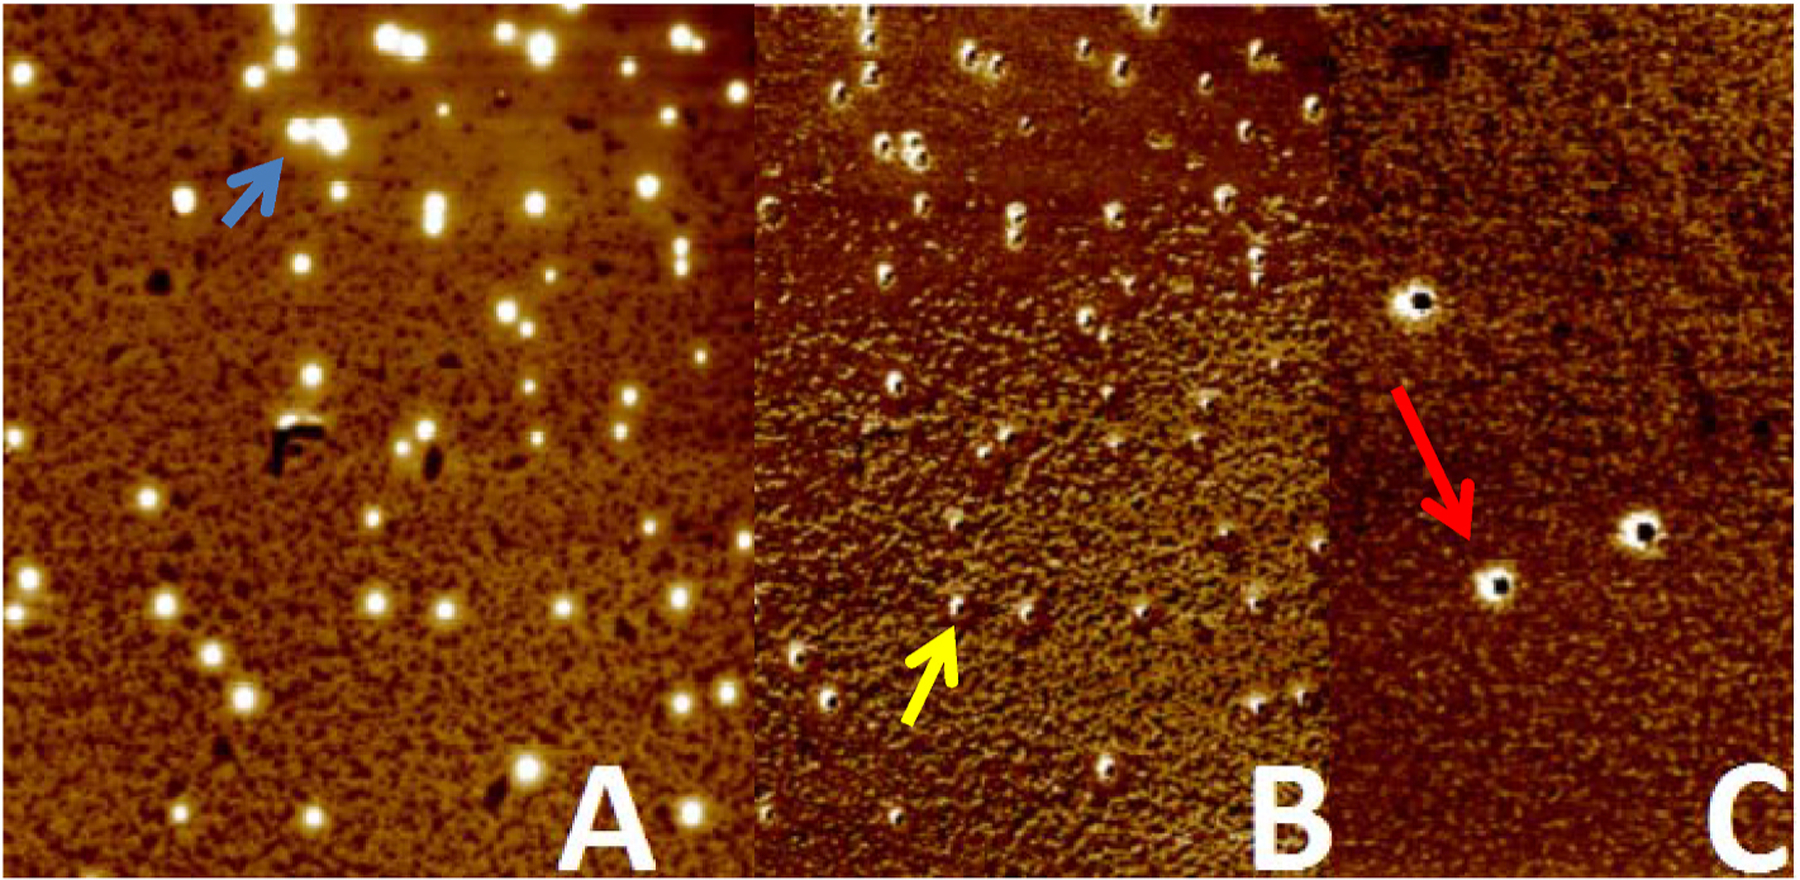
Fig. 3.

A: Overview analysis. B: Topographical analysis and C: QNM mode with energy dispersion analysis. The blue arrow shows the quantum property. The yellow arrow shows the height of the graphene quantum dot and the red arrow shows the energy dispersion regarded to the imatinib complexation. (For interpretation of the references to colour in this figure legend, the reader is referred to the Web version of this article.)
