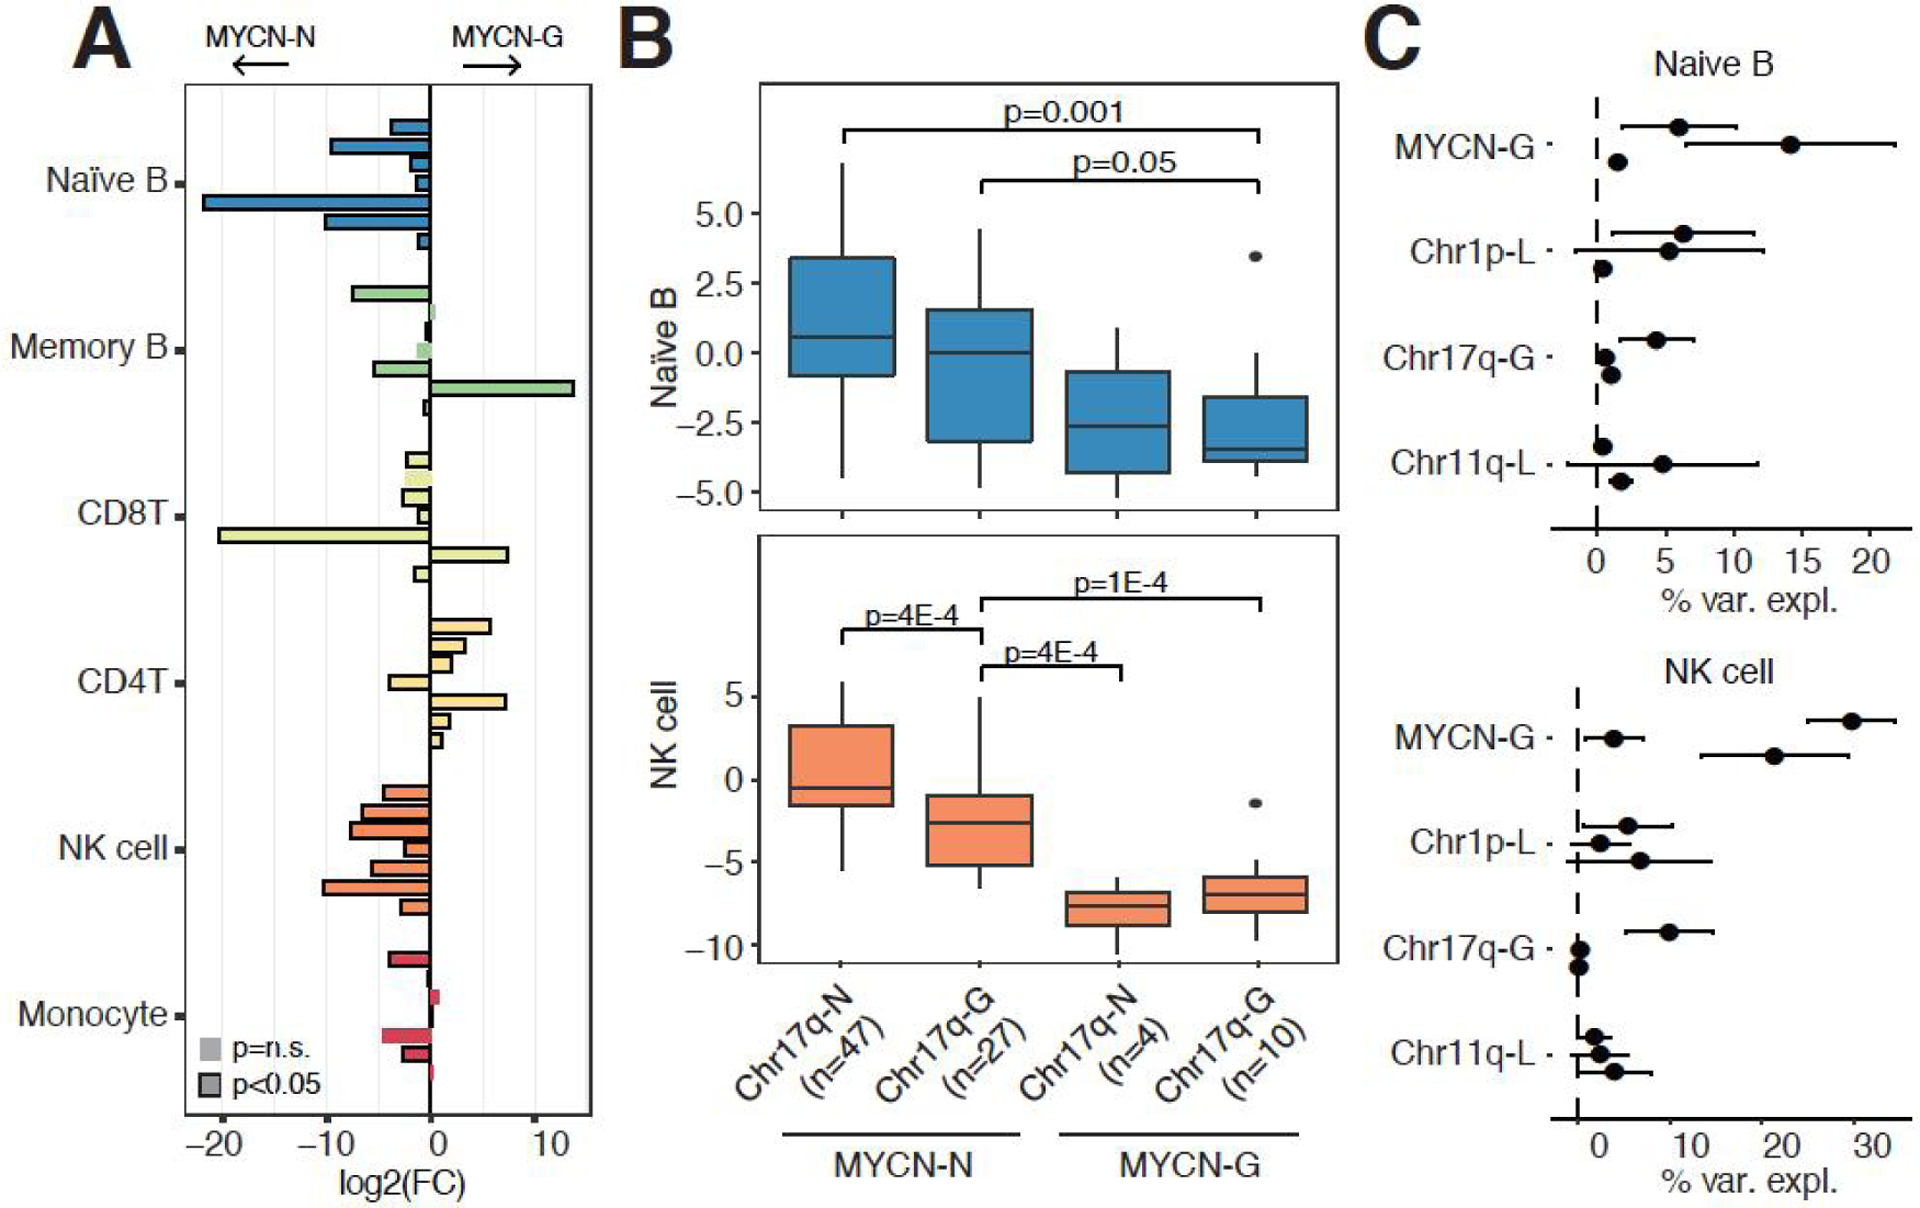
Figure 6.

Immune cell infiltration and chromosomal abnormalities. (A) Bar graph showing the log2 (fold-change) [log2(FC)] comparing immune infiltration between tumors with normal MYCN copy number and tumors with MYCN amplifications. Each comparison was evaluated in seven independent datasets (top to bottom for each immune cell type): Westerman, Wang, SEQC, Rajbhandari, Henrich, Oberthuer, and Kocak. Significance calculated using Wilcoxon-rank sum tests. (B) Comparison of naïve B and NK cell infiltration in patients with or without Chr17q and MYCN chromosomal rearrangements in the Wang dataset. Significance calculated using Wilcoxon-rank sum tests. (C) Percentage of immune cell variance explained by 4 chromosomal rearrangements. Horizontal bars indicate the standard deviation and solid dots indicate the mean variance explained of 100 iterations in which the order of variables was randomly shuffled in each iteration. Each comparison was evaluated in 3 independent datasets (top to bottom for each chromosomal rearrangement): Wang, Lastowska, and Henrich.
