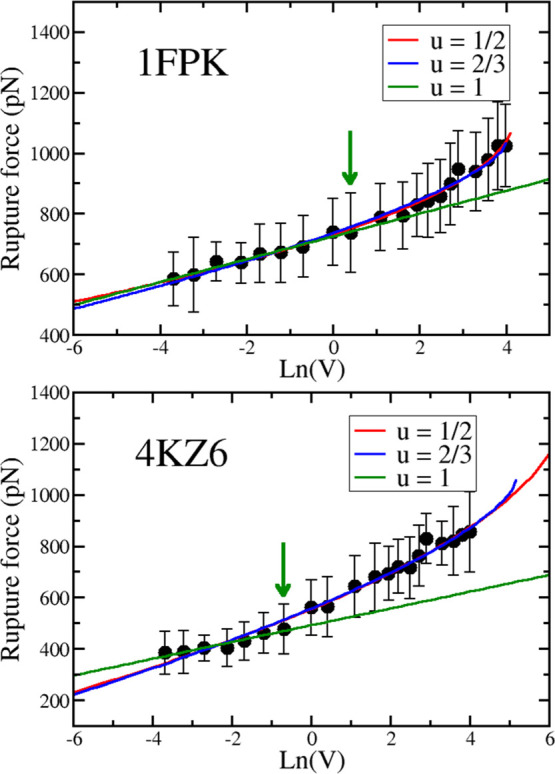
Figure 2.

Dependence of the rupture force Fmax on the logarithm of the pulling speed for complexes 1FKH (top) and 4KZ6 (bottom). The blue line is a linear fit for the first nine data points of 1FPK (R = 0.983) and the first seven points of 4KZ6 (R = 0.955). The correlation level R is shown in parentheses. The arrow indicates the point below which the Bell–Evans theory applies. The red and green curves are nonlinear fits using Dudko–Hummer–Szabo theory with ν = 1/2 and 2/3 for the whole data set (ν = 1 corresponds to Bell–Evans theory). For 1FPK, R = 0.994 and 0.992 for ν = 1/2 and 2/3, respectively, and for 4KZ6, R = 0.991 for both values of ν.
