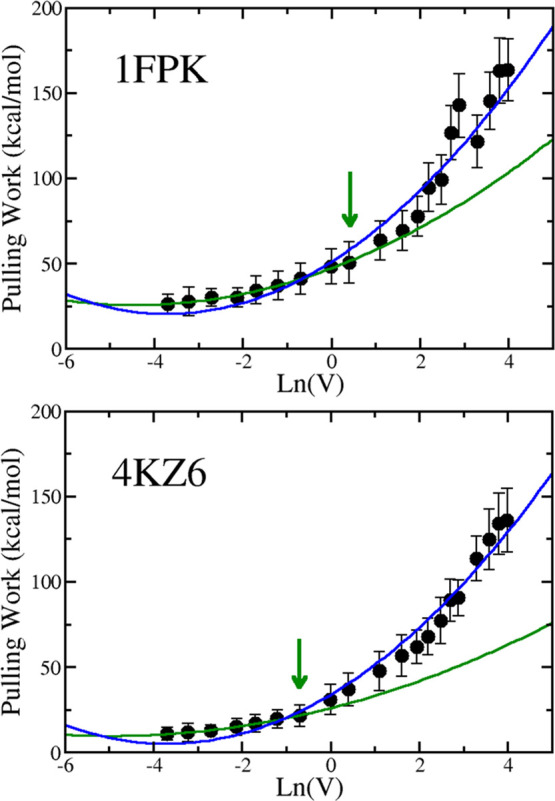
Figure 3.

Dependence of W on ln(V) for 1FKH (top) and 4KZ6 (bottom).The arrow refers to the point below which the rupture Fmax is linear with ln(V). The green curve is a quadratic fit for the first nine data points of 1FPK (R = 0.996) and the first 7 points of 4KZ6 (R = 0.997), which is the area where Bell–Evans theory is valid. The correlation level is indicated in parentheses. The blue curve is also the quadratic fit but for the entire data set with R = 0.983 and 0.988 for 4FPK and 4KZ6, respectively.
