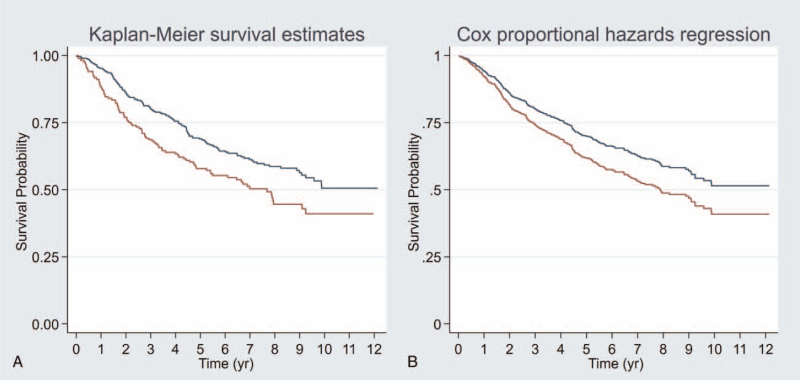
Figure 2.
Overall survival between low NLR (equal or less than 3.0) in red color and high NLR (more than 3.0) in blue color. Figure A was Kaplan–Meier survival curve (crude survival curve). Figure B was postestimation survival curve after Cox-proportional hazards model of adjusted by age, gender, histology, BMI, and AJCC stage (adjusted survival curve). NLR = neutrophil-to-lymphocyte ratio, BMI = body mass index.

