
Figure 5.
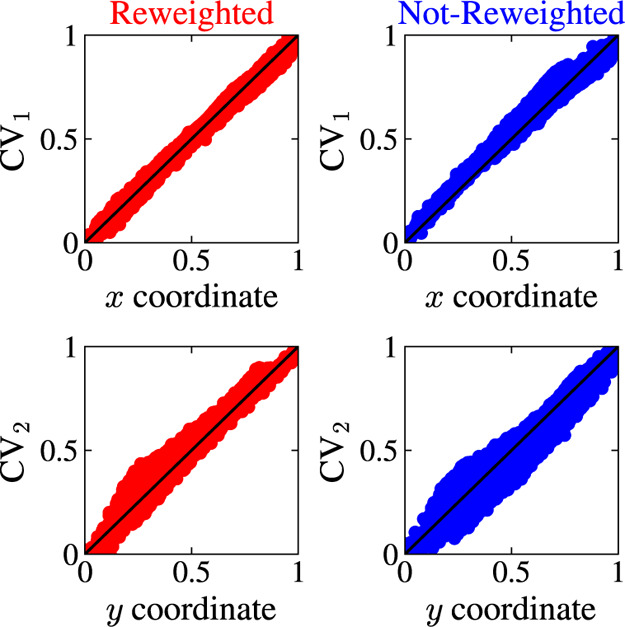
Results for the Müller-Brown potential. We show how the MRSE embeddings map the coordinates x and y by plotting the normalized coordinates x and y versus the normalized MRSE CVs. The MRSE embeddings are trained using data from a WT-MetaD simulation with γ = 5, and obtained with (red) and without (blue) incorporating weights into the training via a reweighted feature pairwise probability distribution (see eq 9). To facilitate comparison, we post-process the MRSE embeddings using the Procrustes algorithm to find an optimal rotation that best aligns with the original coordinates x and y; see text.