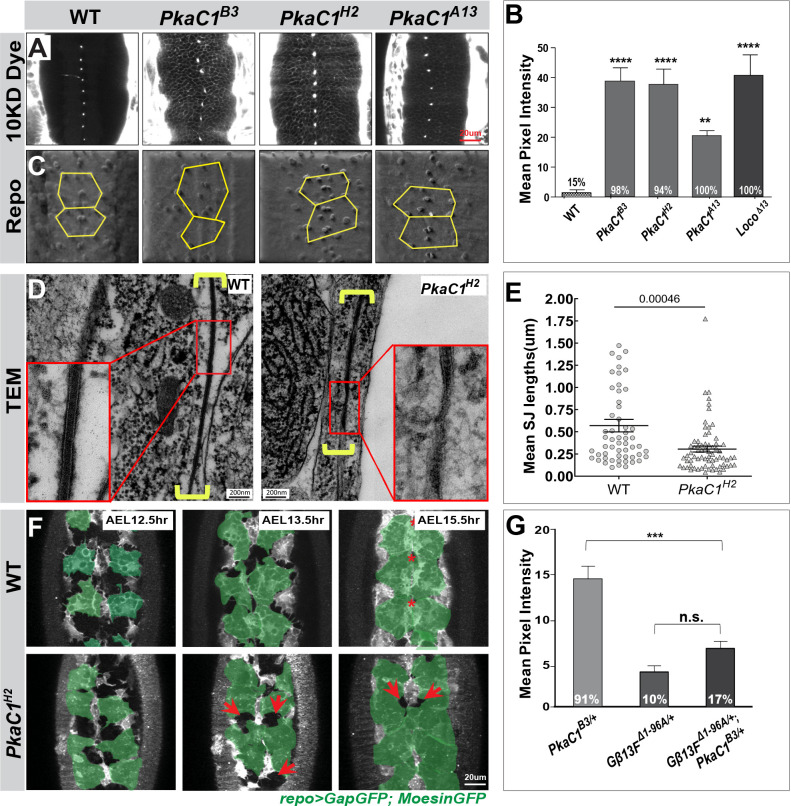
Figure 1. Protein kinase A (PKA) is required for blood–brain barrier (BBB) formation and acts in the Moody signaling pathway.
(A) Single confocal sections of dye-injected embryos of WT and PKA zygotic mutants. (B) Quantification of the dye penetration assay. Columns represent the intensity of dye penetration into the nerve cord as measured by the mean pixel intensity (see Experimental procedures), ± SEM, n = 32, 31, 41, 38, 16 in WT, PkaC1B3, PkaC1H2, PkaC1A13, Loco∆13 embryos, respectively. Loco∆13 zygotic mutants serve as positive controls. (C) Repo staining revealing the number and positions of subperineural glia (SPG) nuclei in WT and PKA zygotic mutants using an illuminated projection to highlight the ventral surface of the nerve cord. (D) Transmission electron micrographs of the interface of neighboring SPG in late WT and PkaC1H2 zygotic mutant embryos. Yellow brackets delineate the septate junction (SJ) ultrastructure; high magnifications are shown in red boxes. (E) Quantification of SJ length in WT and PkaC1H2 mutants (see Experimental procedures). Columns represent mean SJ length as measured in random nerve cord sections, ± SEM, n = 56 and n = 70 in WT and PkaC1H2 mutants, respectively. (F) Time-lapse recording of BBB closure in embryos of WT and PKA zygotic mutants. 6 µm confocal stacks are shown; in each image, 4–6 ventral SPG are highlighted (green); midline channels (stars) and retarded growth (arrows) are marked. (G) Dominant genetic interactions between PkaC1B3 and Gβ13F∆1-96A as quantified by dye penetration in the embryo. Columns represent the intensity of dye penetration as measured by the mean pixel intensity, ± SEM, n = 34, n = 48, and n = 71 in PkaC1B3/+, Gβ13F∆1-96A/+, and Gβ13F∆1-96A/+;PkaC1B3/+ mutants, respectively. In (B) and (G), the percentage of embryos showing the dye penetration is indicated at the bottom of each column. Brackets and asterisks in (B), (E), and (G) indicate statistical significance levels as assessed by ordinary one-way ANOVA with Dunnett’s multiple comparisons test in (B) and (G) or the two-tailed Student’s t-test in (E), n.s., p>0.05; *p<0.05; **p<0.01; ***p<0.001.


