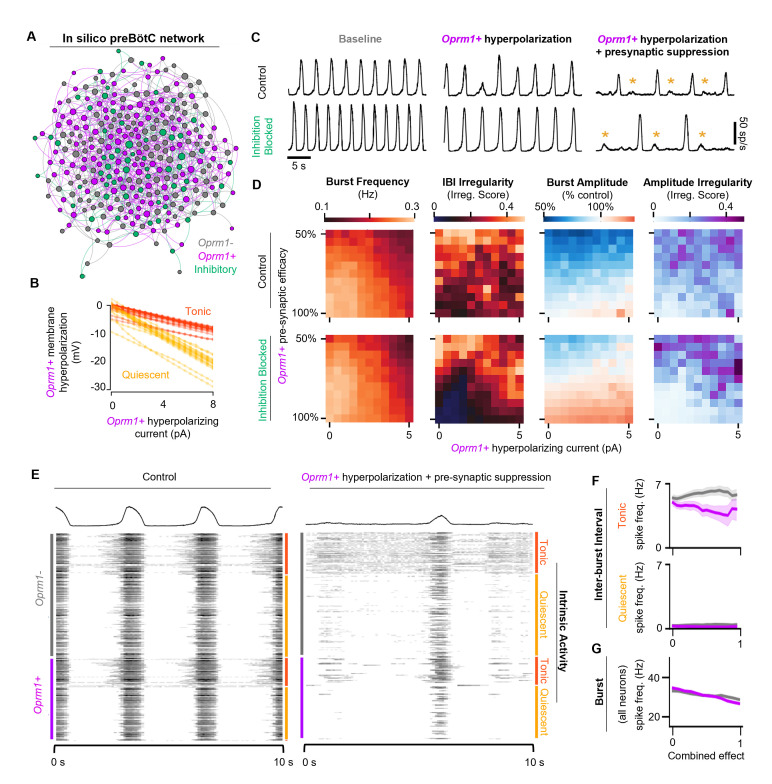
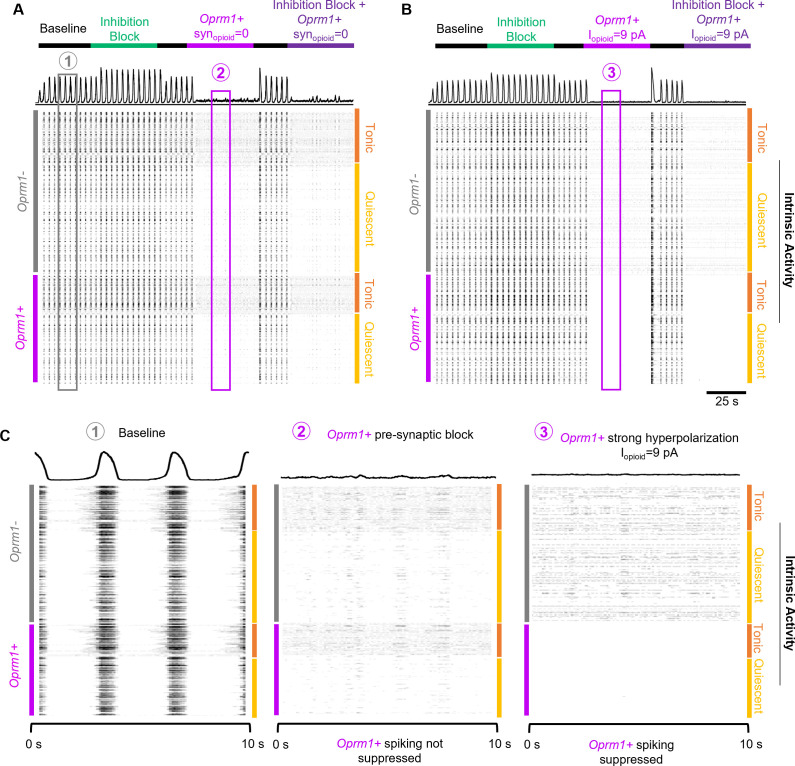
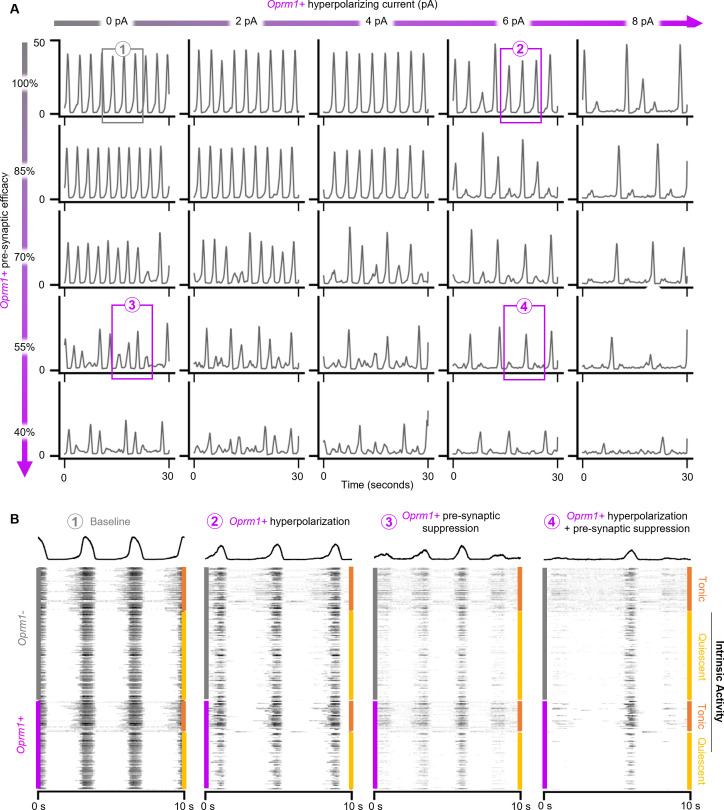
Figure 7. Modeling preBötC MOR activation in silico.
(A) Example model network structure. Model networks were connected randomly and contained excitatory (80%) and inhibitory neurons (20%) that were intrinsically tonic (35%) or quiescent (65%). Half of all excitatory neurons were designated as Oprm1+. Node size and centrality represent the number of synaptic connections. (B) Current/voltage plots for intrinsically tonic (n=17) and quiescent (n=31) Oprm1+ model neurons for the applied opioid-driven hyperpolarization. (C) Example rhythmic activity from the network shown in (A) at baseline, during 6 pA hyperpolarization of Oprm1+ neurons, and during 6 pA hyperpolarization and a 45% reduction in pre-synaptic efficacy of Oprm1+ neurons. Orange asterisks indicate burst failures. (D) Heat maps showing the isolated and combined effects of Oprm1+ neuron hyperpolarization and pre-synaptic suppression on characteristics of the network rhythm. (E) Example spiking activity of all 300 neurons in the model network at baseline and during simulated MOR activation (6 pA hyperpolarization and 45% pre-synaptic suppression of Oprm1+ neurons). (F) Quantified inter-burst interval (IBI) spike frequencies of intrinsically tonic and quiescent Oprm1+ and Oprm1− neurons during simulated MOR activation. (G) Spike frequency during network bursts for all Oprm1+ and Oprm1- model neurons during simulated MOR activation (combined effect of 1 designates 6 pA hyperpolarization and 55% pre-synaptic efficacy of Oprm1+ neurons). Data shown as mean± SE.


