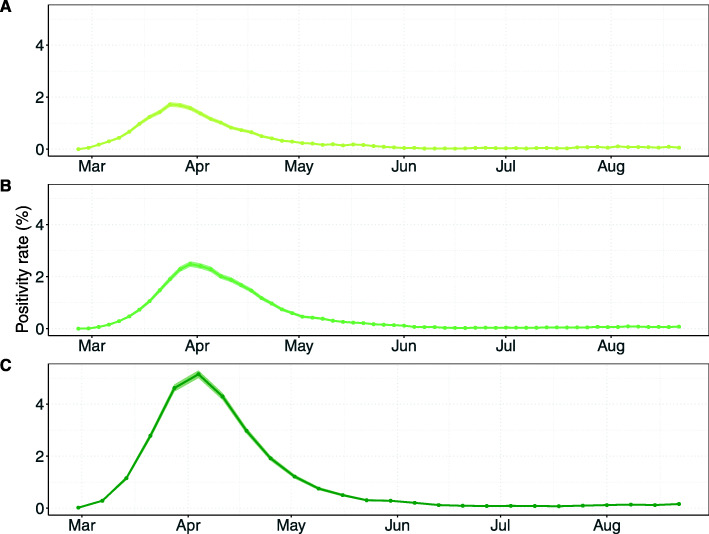
Fig. 7.
Positivity rates over time for screening interventions. Results shown are based on RS = 1.95 and RA = 0.8 (reproduction numbers for the SARS-CoV-2 variant with 56% higher transmissibility with respect to the wild-type SARS-CoV-2 variant). Positivity rates were calculated by the number of positive detected HCWs among the number of tested HCWs using data of all simulation runs combined (points). The shaded regions represent the 95% Bayesian beta-binomial credibility intervals. HCWs who developed symptoms prior to the day of testing were not included in the positivity rate as we assume that they were already correctly identified. A Screening every 3 days with time-invariant perfect test sensitivity. B Screening every 3 days with time-varying imperfect test sensitivity. C Screening every 7 days with time-varying test sensitivity

