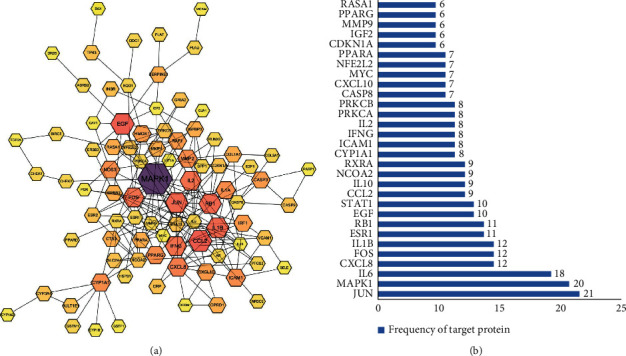
Figure 3.

The protein-protein interaction (PPI) network. (a) Target protein-protein interaction network (PPI) of biologically active ingredients related to the treatment of polycystic ovary syndrome in C. chinensis. Each node represents a related target gene. A greater degree of target PPI is represented by darker colors and larger nodes, and edges with higher merge scores are denoted by darker and thicker lines. (b) Bar graph of the frequency of PPI network target proteins. The x-axis represents the number of target proteins connected to neighboring proteins, whereas the y-axis represents the top 30 target proteins with higher interaction frequencies.
