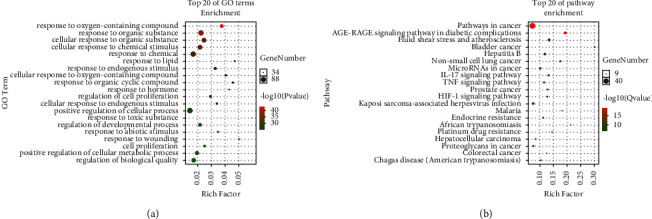
Figure 4.

Enrichment analysis of gene ontology (GO) biological processes and KEGG signaling pathway enrichment analyses. (a) GO tool-based analysis of 102 genes related to polycystic ovary syndrome. The x-axis represents the enrichment factor of the target gene, and the y-axis represents the “biological process” category, where the target gene is enriched in GO (P < 0.01). The size of the bubble area represents the number of genes belonging to the GO item in the target gene. The color of the bubble indicates the concentration, and a darker color indicates a higher importance. (b) KEGG signal pathway enrichment analysis. The x-axis represents the enrichment factor of the target gene, whereas the y-axis represents the main signal pathway (P < 0.01); the size of the bubble in the figure represents the number of genes belonging to the pathway in the target gene. The color of the bubble indicates the importance of enrichment; a red color indicates a higher importance.
