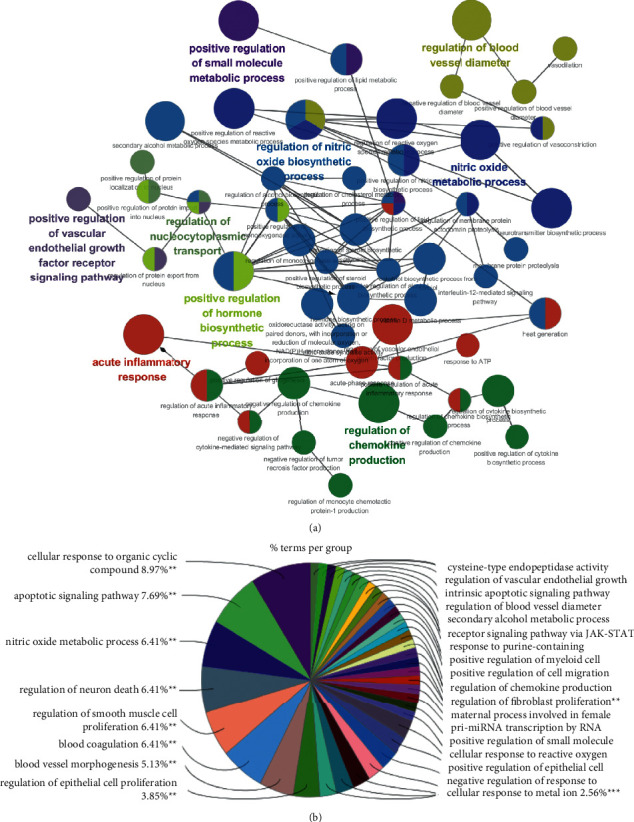
Figure 5.

Biological function classification of 102 genes related to polycystic ovary syndrome using the Cluego tool. (a) The Cluego tool analyzed 102 genes related to polycystic ovary syndrome. Different node colors represent the biological process of enrichment. The size of the node indicates the degree of enrichment. The larger the node, the higher the degree of enrichment. The connections are represented by a line. (b) Enrichment analysis of the gene ontology (GO) terms. The area of the pie chart represents the proportion of the target genes enriched in different biological processes.
