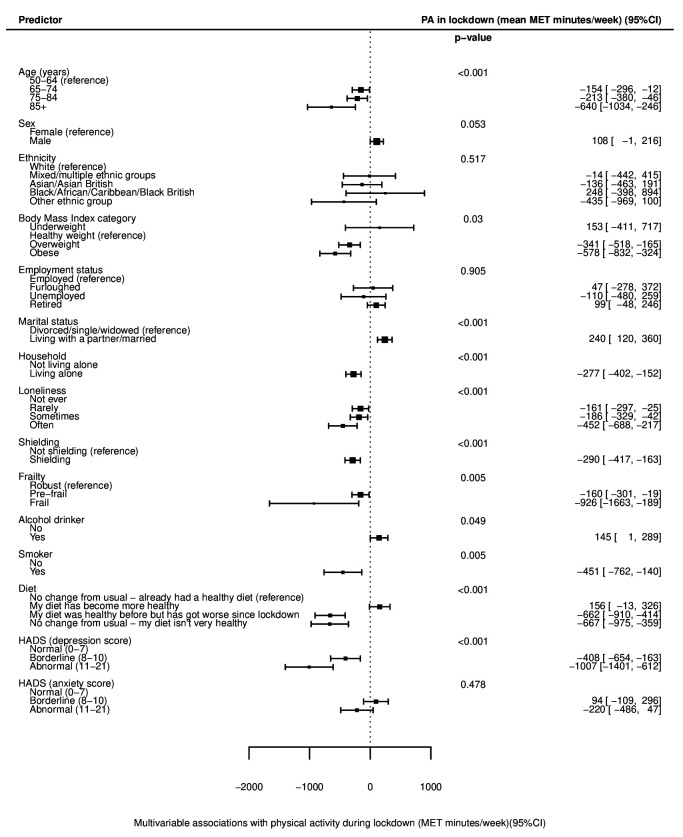
Figure 3.
Forest plot of multivariable associations with physical activity (PA) after the introduction of lockdown (during/in lockdown), adjusted for age, sex, ethnicity, month of year of survey completion and baseline PA. Data presented as mean MET min/week±95% CI, compared with the reference group, with negative values indicating lower PA than the reference. See also online supplemental table S4. HADS, Hospital Anxiety and Depression Scale; MET, metabolic equivalent of task.

