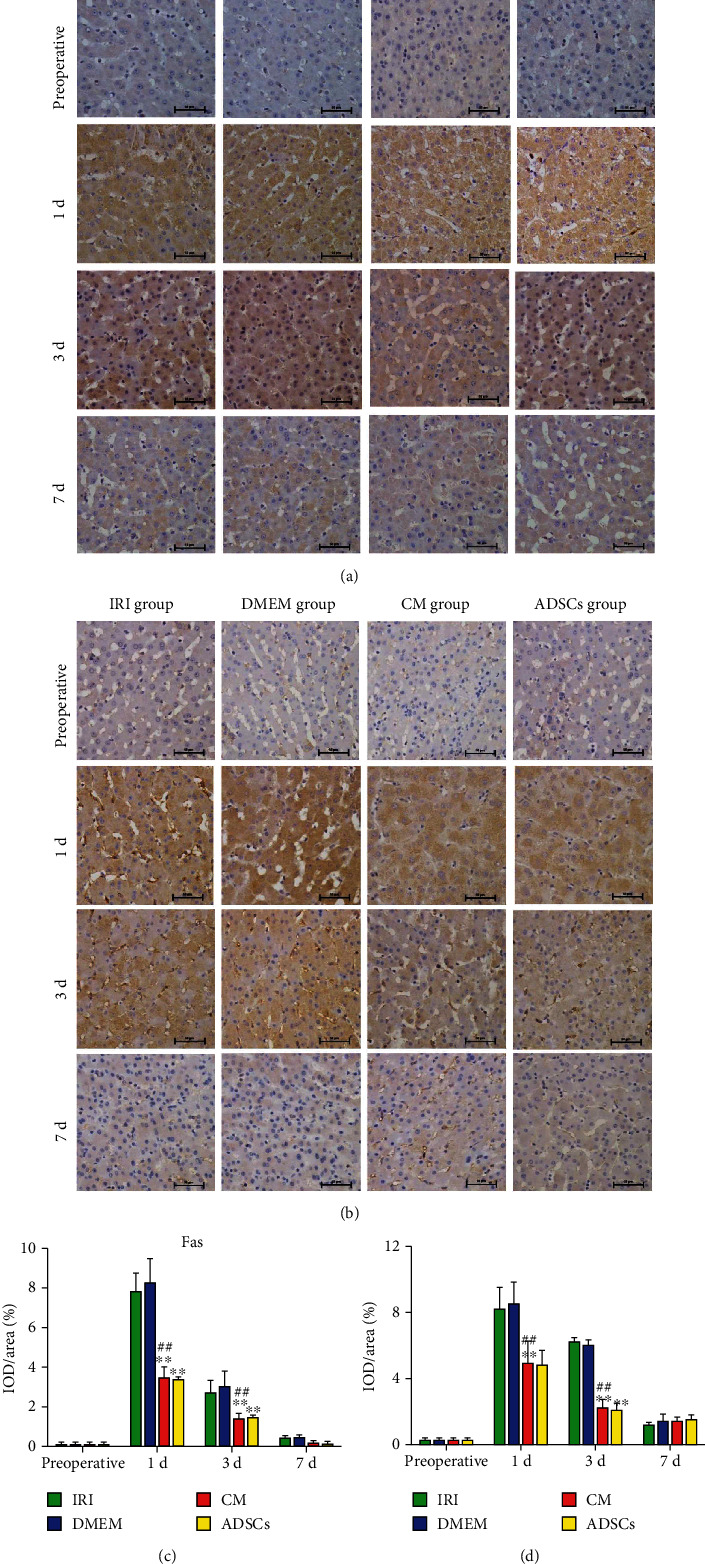
Figure 5.

In situ expression levels of Fas and Fasl protein in liver tissues. (a, b) Representative images of immunohistochemically stained Fas and Fasl protein in the indicated groups (magnification 400x). (c, d) Relative expression levels of Fas and Fasl. ∗P < 0.05 and ∗∗P < 0.01 compared to IRI group; #P < 0.05 and ##P < 0.01 compared to DMEM group.
