
Figure 6.
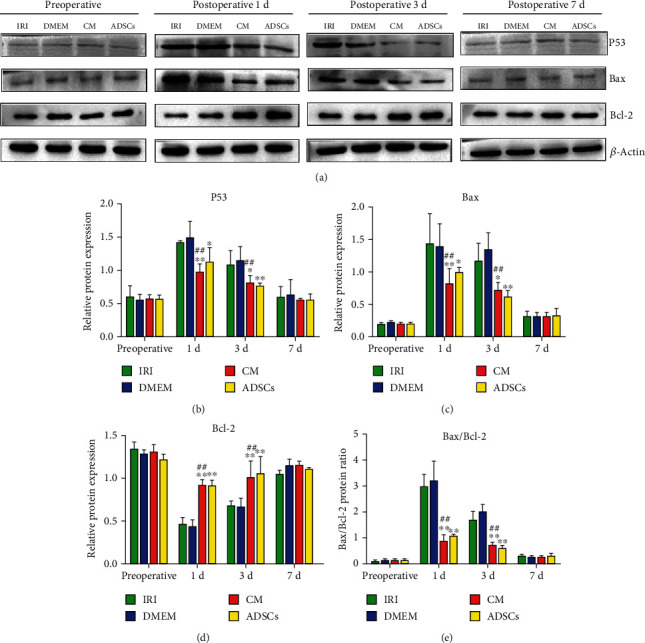
Expression levels of apoptosis-related proteins in liver tissue: (a) representative immunoblot showing P53, Bax, Bcl-2, and β-actin levels in the indicated groups. (b–e) Quantification of P53, Bax, Bcl-2, and Bax/Bcl-2 ratio. ∗P < 0.05 and ∗∗P < 0.01 compared to IRI group; #P < 0.05 and ##P < 0.01 compared to DMEM group.