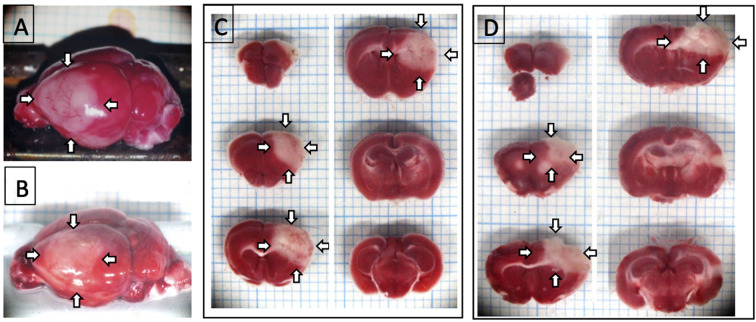
Fig. 1.
Region of brain damage in the PIT-F model. A and B: Photographs of the TTC-stained brain surface of C57BL/6J mice (A) and BALB/c mice (B) on day 1. C and D: Specimen photomicrographs of TTC-stained 1-mm thick brain slices of C57BL/6J mice (C) and BALB/c mice (D). White regions indicated by arrows are damaged regions. Comparable results were obtained in 6 C57BL/6J mice and 4 BALB/c mice. The width of the grid behind the brain and sections was 1 mm.

