Fig. 5.
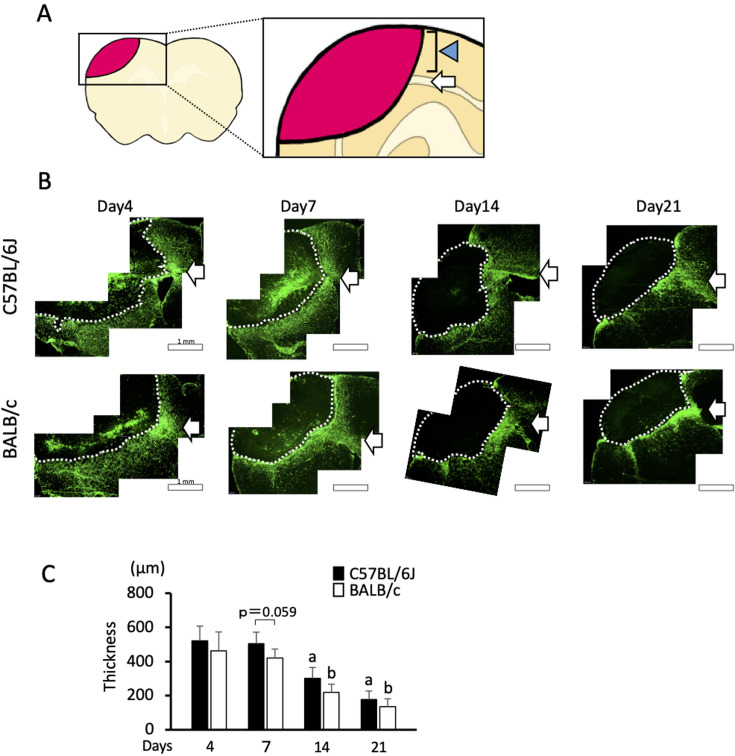
Immunohistochemistry for GFAP. A: Picture of the brain section. A square indicates an analyzed area. The arrow indicates the white matter. Arrowhead indicates the cortex where the thickness is measured. B: Photomicrographs of GFAP-stained brain sections from C57BL/6J and BALB/c mice on days 7, 14, and 21. Dotted lines indicate the border of the damaged area. The arrows indicate white matter. Bars indicate 1 mm. C: Quantified thickness of the GFAP-positive layer surrounding the damaged area in the cortex on days 7, 14, and 21. Data represent the mean and SD. a: P<0.05 vs. day 1 in C57BL/6J mice b: P<0.05 vs. day 1 in BALB/c mice. n=5, 5, and 4 C57BL/6J mice were used on days 7, 14, and 21, respectively, and n=5, 5, and 5 BALB/c mice were used on days 7, 14, and 21, respectively.

