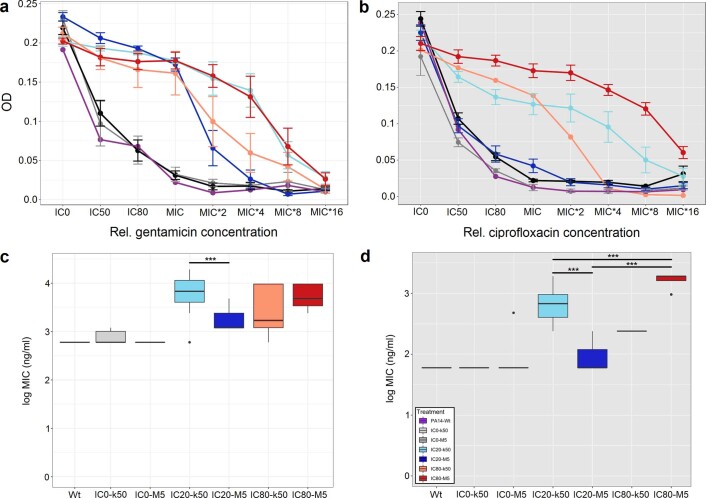
Extended Data Fig. 6. Dose response tests of evolved populations.
a + c: Gentamicin experiment, b + d: Ciprofloxacin experiment. a, b, Dose Response Curves: X-axes represent the levels of tested drug concentrations relative to the PA14 reference. The Y-axes represent the final OD of the tested bacterial populations at 600 nm after 12 hours of incubation. Error bars represent standard error of mean (8 replicates). See Extended Data Table A E for summary of tested drug concentrations. c, d, Minimum inhibitory concentrations obtained from resistance assays: X-axes represent the treatment groups during the evolution experiments and the ancestral wildtype PA14. The Y-axes represent the lowest drug concentration of the resistance assays (ng/ml, logarithmic scale), for which growth was no longer detectable. Evolved populations were incubated for 12 hours at antibiotic concentrations summarized in Extended Data Table AE. Growth was determined by optical density measurements. Significant difference between two treatment groups is indicated by *** (always p < 0.05 based on TukeyHSD). Purple: PA14 ancestor; Grey: evolved no-drug controls; Blue: IC20 treatments; Red: IC80 treatments; light colours represent k50 transfers; dark colours represent M5 transfers.

