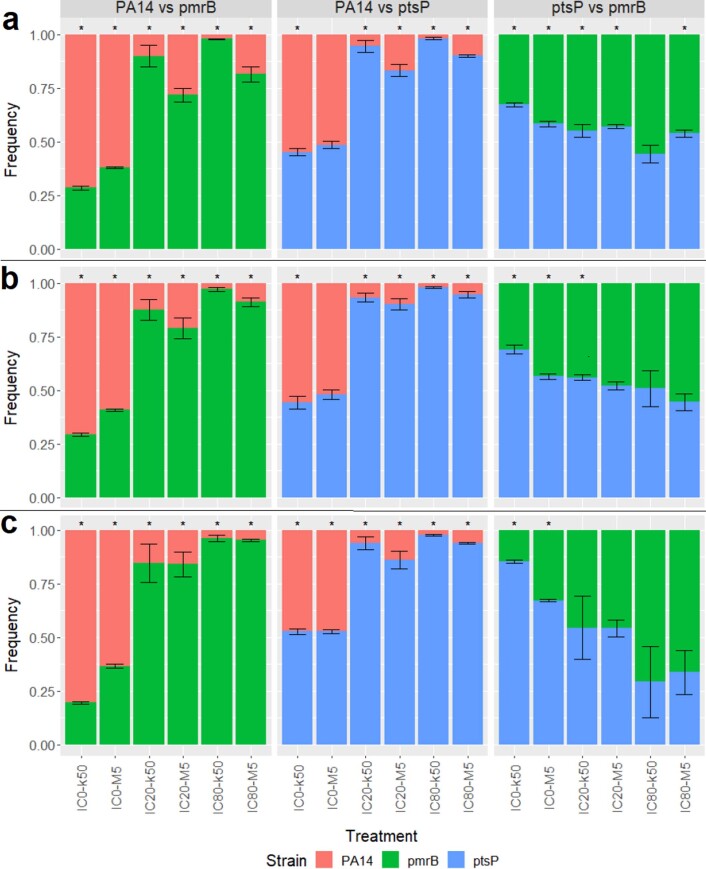
Extended Data Fig. 10. Competition outcomes of the three separate experiments.
a, A12 vs D12. Clones originated from the IC80-k50 evolution treatment. b, A6 vs B11. Clones originated from the IC20 evolution treatments. c, A5 vs E7. Clones originated from the IC80-M5 evolution treatment. Different mutant clones, which evolved in the GEN evolution experiment, competed against one another. Competitions included eight technical replicates for every condition. The X-axis indicate the different competition treatment conditions. The Y-axes represent the relative frequency of the clones. Colours refer to different clonal variants: Red = Wt, Green = pmrB, Blue = ptsP. Error bars represent the standard error based on five technical replicates for each treatment. Asterisks represent significant difference in frequency between two strains (* p < 0.05; two sample t-test).

