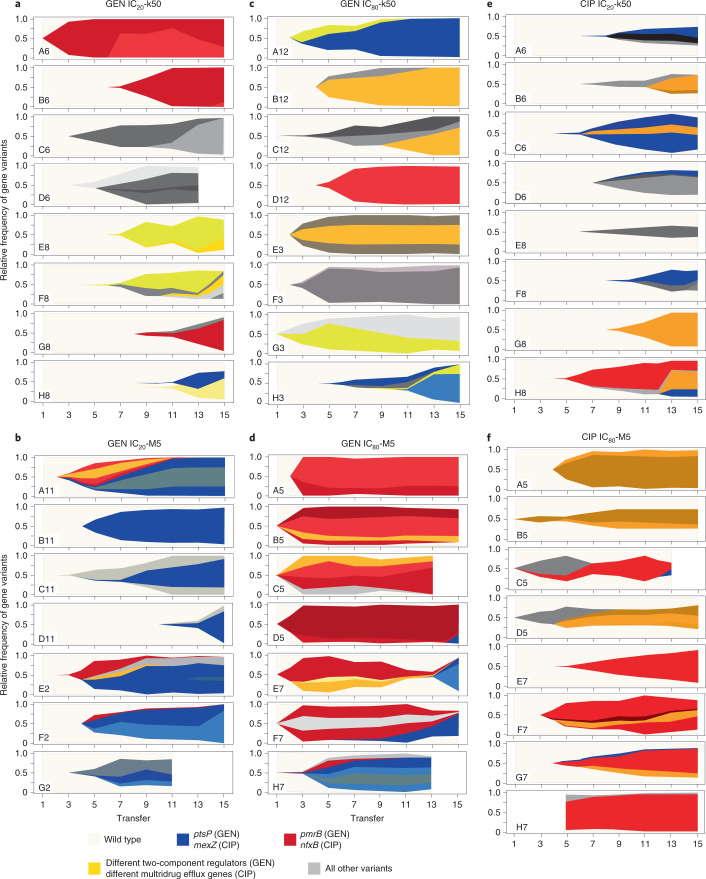
Fig. 3. Weak bottlenecks generally lead to early spread of new variants and more competitive dynamics, but only few affected genes across replicate populations during the evolution experiments.
a–d, Results for replicate populations from the GEN evolution experiment for IC20-k50 (a), IC20-M5 (b), IC80-k50 (c) and IC80-M5 (d). The IC20-M5 H2 population and the IC80-M5 G7 population were excluded because they could not be recovered from across the evolution experiment. e,f, Results for replicate populations from treatments of the CIP evolution experiment for IC20-k50 (e) and IC80-M5 (f). The x-axes represent the transfer period, the y-axes show the relative frequency of gene variants in a population. Population names are shown in the bottom left corner of each plot. The main colours denote the most frequently affected genes with variants for each of the two evolution experiments. Different shades further indicate different variants of the gene of that colour. Extended Data Figs. 7 and 8 show frequency dynamics of the individual mutations.

