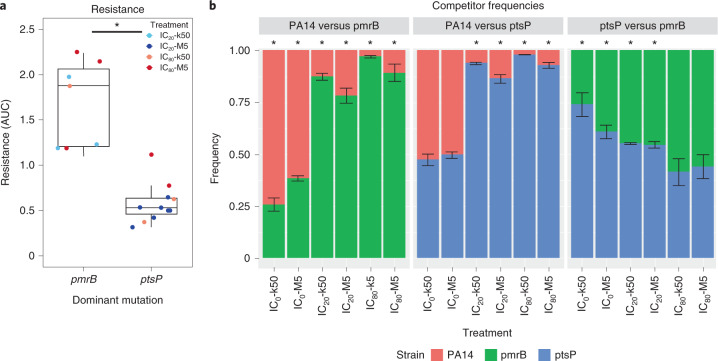
Fig. 4. ptsP variants confer higher competitiveness under low GEN concentrations yet lower GEN resistance than pmrB variants.
a, Populations with the most frequent mutation in ptsP showed significantly lower resistance than populations with the most frequent mutation in pmrB. The x-axis represents genes affected by most frequent mutations. The y-axis represents AUC as a proxy for resistance to GEN. *P < 0.05, general linear model (GLM) statistical analysis. b, ptsP variants had a competitive advantage over pmrB variants in competition experiments with low drug concentrations. The x-axis represents the different treatment conditions. The y-axis shows the relative frequency of the competitors. Colours indicate competitor variant or wild type. In competition experiments, cultures of competing strains were mixed at a 1:1 ratio. Data are mean ± s.e.m. of three independent biological replicates for each treatment. The mean of each biological replicate was based on five technical replicates (Extended Data Fig. 10). Asterisks at the top indicate significant difference in frequency between the two competitors (*P < 0.05; two-sample t-test).

