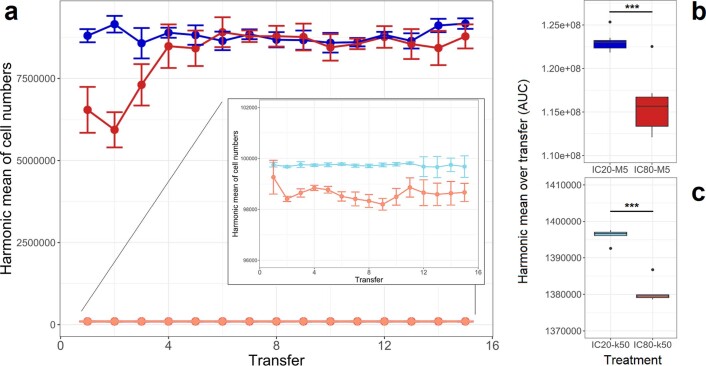
Extended Data Fig. 3. Harmonic means of cell concentrations during the CIP evolution experiment.
a, Harmonic means per treatment group over time, b, AUC of harmonic means over transfer for weak bottleneck treatments, c, AUC of harmonic means over transfer for strong bottleneck treatments. The harmonic mean between starting population size and endpoint population size was calculated per transfer period for every population. Panel a shows the mean and standard error for every group at every transfer. Panels b and c summarize the AUCs shown in panel a for every group. Blue: IC20 treatments; Red: IC80 treatments; light colours represent k50 transfers; dark colours represent M5 transfers. Significant difference between two treatment groups is indicated by *** (always p < 0.05 based on Welch t-test).

