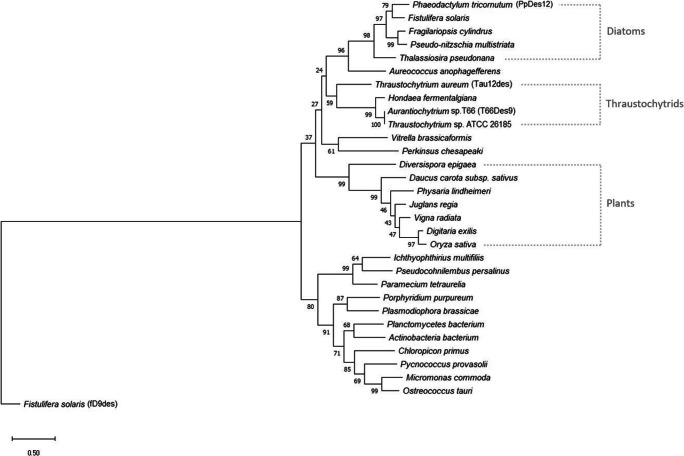
Fig. 2.
Phylogenetic analysis of T66Des9 and its homologs from the GenBank search. The homologs’ names and information were summarized in Supplemental Table S4 and shown here only with the species name unless selectively indicated with parentheses. The tree with the highest log likelihood (−20940.42) is shown. The tree is rooted with fD9des. The scale bar shows a distance of 0.5 substitutions per residue. The percentage of replicate trees in which the associated taxa clustered together in the bootstrap test (1000 replicates) are shown next to the branches (Felsenstein 1985)

