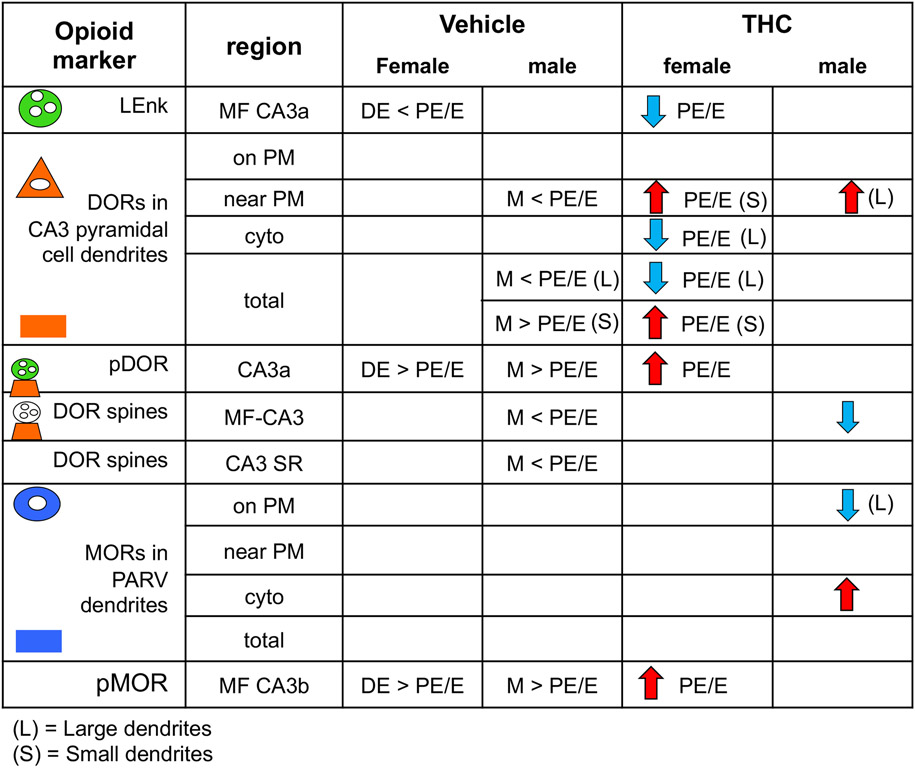
Fig. 10. Comparison of sex differences in the rat hippocampal opioid system following VEH and acute THC injection.
Greater than (>) or less than (<) symbols indicate baseline sex differences in VEH-injected rats. PE/E, proestrus estrus; DE, diestrus. Red arrows indicate increases whereas blue arrows indicate decreases following acute THC injections.

