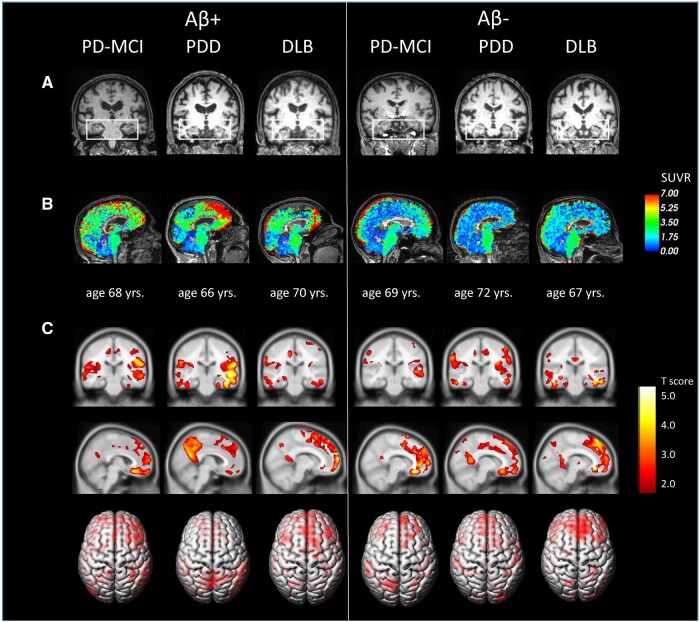
Figure 4.
Representative images of LBDs patients according to Aβ status. (A) Visual assessments of Medial temporal lobe Index (MTA) in PD and DLB patients with/without Aβ, showing absence of mild to moderate MTA atrophy. Coronal T1w-3D views. (B) PET-MRI [18F]Flutemetamol SUVR maps obtained with cortical cerebellum as reference after three compartment Müller-Gärtner partial volume correction with PETsurfer. SUVR maps are overlaid onto each participant’s native T1-weighted 3D, showing significant Aβ deposits in frontal–striatal regions, anterior and posterior cingulate areas and precuneus. (C) Statistical non-parametric maps of significant voxel-based grey matter atrophies in frontal–striatal regions, anterior and posterior cingulate, precuneus and middle temporal areas in LBDs. Statistical maps are overlaid onto the standard MRI template after normalization to the MNI space using CAT12 tool pipeline.

