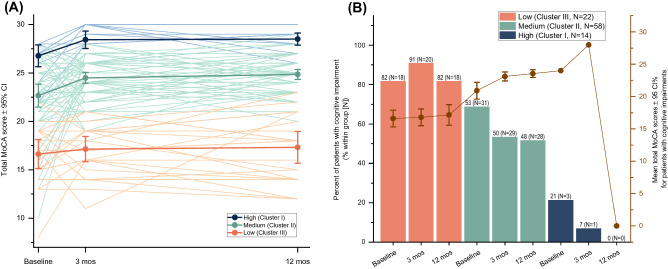
Figure 2.
(A) Individual changes in total MoCA score over time in the different cognitive functioning groups (high, medium and low) and mean total MoCA scores of each cognitive functioning group are shown. (B) Percent of patients with cognitive impairment within each cognitive functioning group after age, sex and education-matching with the Swedish population. The light brown line represents the mean total MoCA of patients with cognitive impairment for each group. MoCA Montreal Cognitive Assessment, CI confidence interval, mos months.

