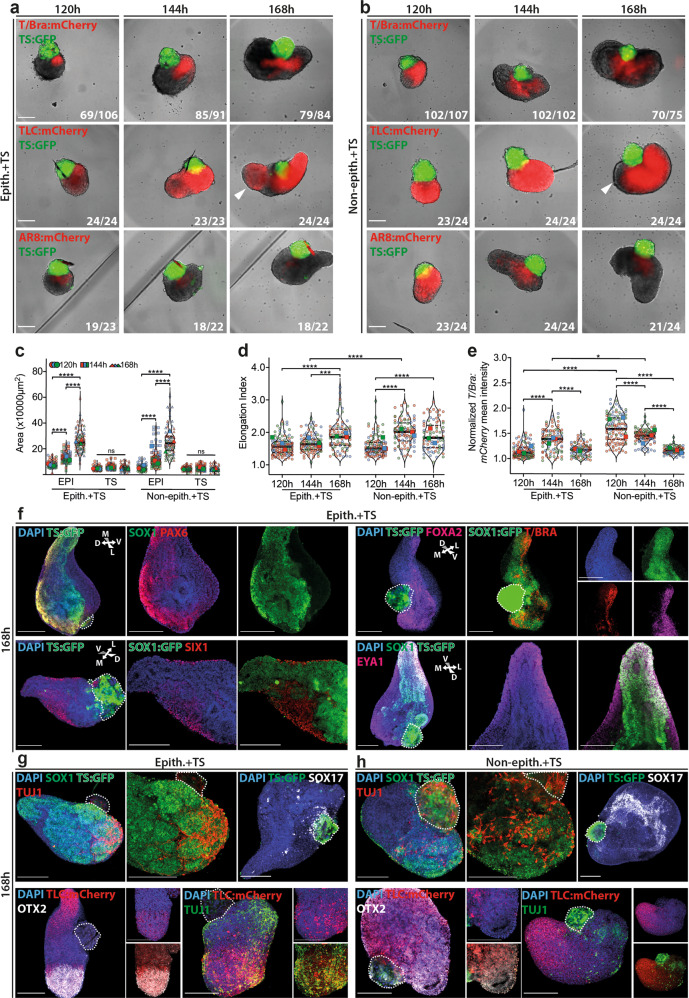
Fig. 4. Axial morphogenesis in EpiTS embryoids.
a, b Representative images showing T/Bra:mCherry (top), TLC:mCherry (middle), and AR8:mCherry (bottom) expression dynamics in epithelialized (a) and non-epithelialized (b) EpiTS embryoid between 120 and 168 h. c–e Quantification of total EPI vs TS area (c), elongation index (d), and background normalized T/Bra:mCherry mean intensity (e) in epithelialized or non-epithelialized embryoids between 120 and 168 h. For elongation index quantification, TS subtraction was performed. Data was collected from three biologically independent experiments. For d, adjusted p-values are: Epith.+TS (144 h) vs Epith.+TS (168 h), p = 0.0002. For e, Epith.+TS (144 h) vs Non-epith.+TS (144 h), p = 0.0277. f Representative confocal images showing Sox1, Pax6, T/Bra, Foxa2 (top panel) Six1, Eya1 (bottom panel) immunostainings at 168 h in epithelialized embryoids. g, h Representative confocal images showing Sox1, Tuj1, Sox17 (top panel), and mCherry, Otx2, Tuj1 (bottom panel) immunostainings at 168 h in epithelialized (g) or non-epithelialized (h) embryoids. Nuclei were stained with DAPI. TS cells were depicted with dashed line. All embryoids were formed from 100ESC/100TSC condition. For all conditions in a–e, number of mCherry-positive embryoids over total number of embryoids analyzed are indicated at bottom right of a, b. Large symbols indicate mean values of each replicate. Black lines indicate median and quartiles. For all statistical analysis, one-way ANOVA followed by Tukey multiple comparison test was performed. Following P value style was used: (****) < 0.0001, (***) 0.0002, (**) 0.0021, (*) 0.0332, (ns) 0.1234. Scale bars: 200 µm. Source data are provided as a Source Data file.

