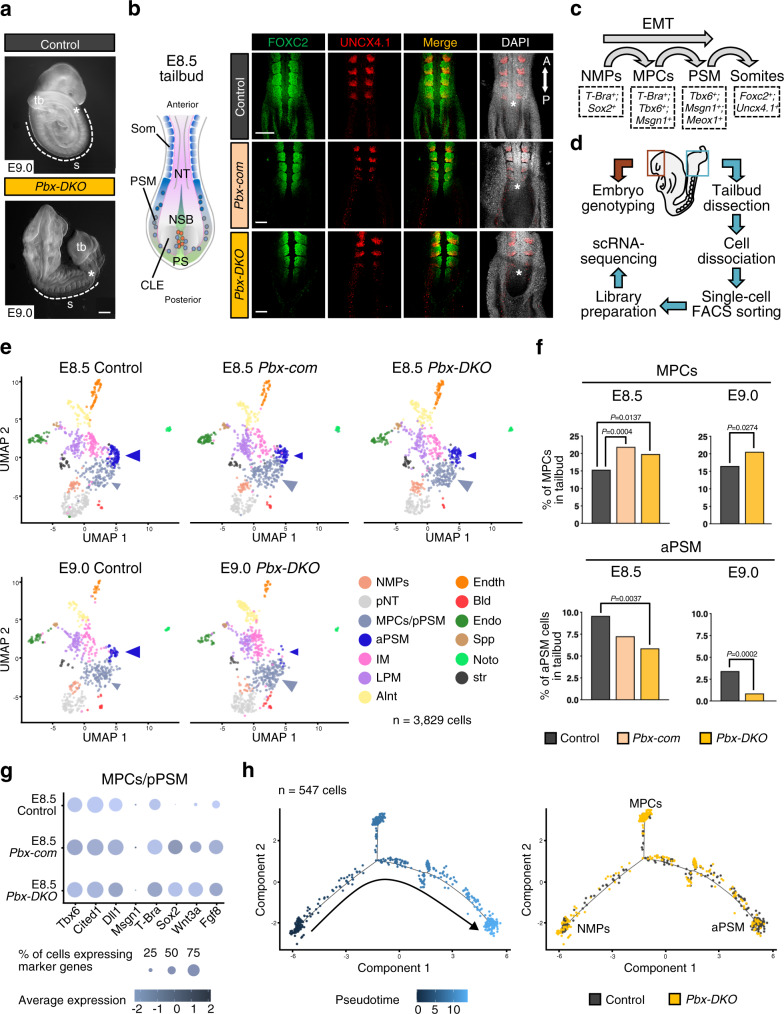
Fig. 1. PBX proteins control the transition of NMPs towards PSM, underlying the acquisition of paraxial mesoderm identity.
a Gross morphology of E9.0 Pbx1−/−;Pbx2−/− (Pbx-DKO) embryos showing enlarged tailbud (tb), shortened trunk and rudimentary somites (s). Scale bar: 200 µm. b Dorsal views of E8.5 Pbx1−/−;Pbx2+/− (Pbx-com) and Pbx-DKO mouse embryos stained with FOXC2 (green) and UNCX4.1 (red) antibodies display abnormal somitogenesis. The cartoon on the left is a schematic representation of the E8.5 mouse tailbud. CLE caudal lateral epiblast, NSB node-streak border, PS primitive streak, PSM pre-somitic mesoderm, Som somites, NT neural tube, A anterior, P posterior. Scale bars: 70 µm. In a and b, asterisks denote the newly generated somites. c Schematics illustrating paraxial mesoderm differentiation from bipotent NMPs to somites, showing intermediate states and associated lineage markers. EMT epithelial-to-mesenchymal transition. d Strategy used to perform single-cell RNA-seq (scRNA-seq) of mouse embryonic tailbuds. e ScRNA-seq of E8.5/E9.0 control, Pbx-com and Pbx-DKO embryonic tailbuds. Unsupervised clustering and UMAP visualisation reveal reduced aPSM (dark blue arrowhead) and expanded MPCs/pPSM (light blue arrowhead) cell populations in Pbx mutants. Individual cells are coloured according to annotated cluster identities: NMPs neuromesodermal progenitors, pNT pre-neural tube, MPCs/pPSM mesodermal progenitor cells/posterior pre-somitic mesoderm, aPSM anterior pre-somitic mesoderm, IM intermediate mesoderm, LPM lateral plate mesoderm, Alnt allantois, Endth endothelial cells, Bld blood, Endo endoderm, Spp splanchnopleura, Noto notochord, str stressed cells. f Percentage of MPCs and aPSM cells in control (black), Pbx-com (light pink) and Pbx-DKO (yellow) tailbuds at E8.5 and E9.0. P-values indicated in the figure were calculated by two-sided Fisher’s exact test. g Expression analysis of selected lineage markers within the MPCs/pPSM cluster isolated from control and Pbx mutant tailbuds. Dot plot shows the relative expression of the NMP markers T-Bra, Sox2, Wnt3a, Fgf8, and the mesodermal genes Tbx6, Cited1, Dll1, Msgn1, indicating co-expression of NMP and MPC markers in Pbx-com and Pbx-DKO embryos. Colour bar indicates the intensity associated with normalised expression values. h Monocle’s pseudotemporal ordering of paraxial mesoderm-related clusters displaying the progressive maturation of control cells (black) from NMPs to aPSM and the defective NMP-to-PSM transition of Pbx-DKO cells (yellow).

