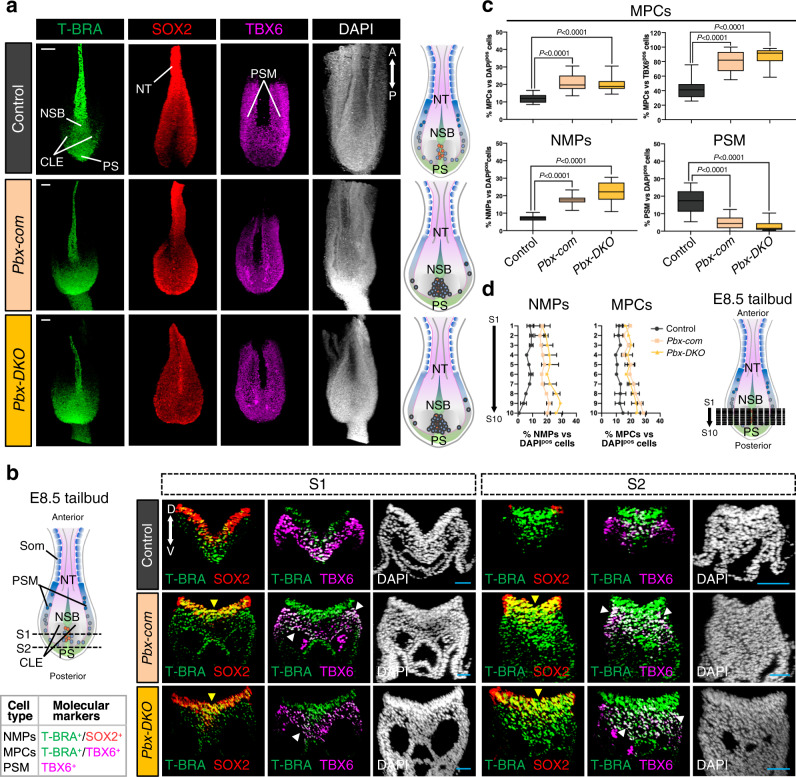
Fig. 2. Pbx mutant NMPs fail to acquire paraxial mesodermal fate, do not progress towards PSM, and accumulate in the tailbuds.
a Confocal maximum intensity projection images of E8.5 tailbuds probed with T-BRA (green), SOX2 (red) and TBX6 (magenta) antibodies and counterstained with DAPI (grey) reveal the enlarged CLE and accumulation of T-BRApos, SOX2pos, TBX6pos cells in Pbx-com and Pbx-DKO tailbuds. The cartoons on the right depict dorsal views of E8.5 control and Pbx mutant tailbuds, with NMPs represented as red dots and MPCs as blue dots. Scale bars: 50 µm. b Confocal transverse sections of control, Pbx-com and Pbx-DKO tailbuds through the caudal progenitor zone. Black dashed lines in the cartoon indicate the plane of sections. Representative sections S1 and S2 reveal accumulation of T-BRA/SOX2 double-positive (T-BRApos;SOX2pos) NMPs in Pbx mutants (yellow arrowheads). TBX6 staining shows reduced expression in PSM and co-localisation with NMP markers in Pbx-com and Pbx-DKO tailbuds (white arrowheads). The panel on the left summarises the molecular signature used to identify the different cell types along the path towards PSM. Scale bars: 30 µm. c Box plots assessing the proportion of T-BRApos;TBX6pos cells (MPCs) relative to DAPIpos cells (total cells) or to TBX6pos cells (PSM), and T-BRApos;SOX2pos cells (NMPs) and TBX6pos cells (PSM) relative to DAPIpos cells. The box contains the 25th to 75th percentiles of the dataset, the centre line denotes the median value (50th percentile) and the whiskers extend from the smallest to the largest value. P-values were calculated by one-way ANOVA and Tukey’s test for multiple comparisons and are indicated in the figure. d Distribution of NMPs and MPCs along the anterior/posterior axis shows accumulation of NMPs and MPCs in the posterior tailbud of Pbx-com and Pbx-DKO embryos. Data are mean ± s.e.m. Black dashed lines in the cartoon indicate the plane of sections. In c and d, the percentage of different cell types for each embryo was calculated from 10 independent sections equally distributed along the anterior/posterior axis. In a, b and d: CLE caudal lateral epiblast, NSB node-streak border, PS primitive streak, PSM pre-somitic mesoderm, Som somites, NT neural tube, A anterior, P posterior, D dorsal, V ventral.

