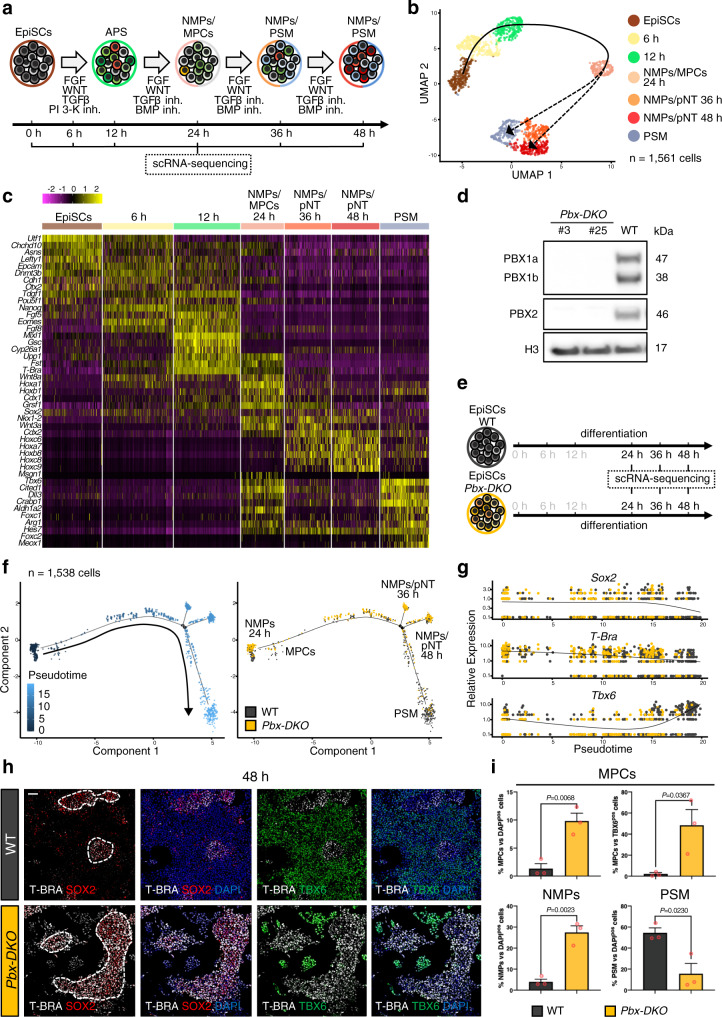
Fig. 3. Pbx mutant cells fail to acquire paraxial mesoderm identity in vitro.
a Schematics of the in vitro protocol used to differentiate EpiSCs towards anterior primitive streak (APS) and pre-somitic mesoderm (PSM). b ScRNA-seq of in vitro PSM differentiation. Cells were harvested at different time-points, as indicated in a. Unsupervised clustering and UMAP visualisation reveal temporally distinct populations of NMPs (orange-red), MPCs (light pink) and PSM (light blue). Individual cells are coloured according to annotated cluster identities. Reconstructed developmental trajectories are indicated with black dashed lines. c Heatmap showing expression of key genes along the path towards PSM. Cells acquire a NMP signature at 24 h, and subsequently undergo progressive maturation towards PSM. NMPs present at 36–48 h express higher levels of posterior Hox genes (Hox6-9), consistent with the acquisition of more posterior axial identity. Colour bar indicates the intensity associated with normalised expression values. d Western blot analysis confirms absence of PBX1 and PBX2 proteins in the Pbx-DKO cell lines obtained by inactivating Pbx1 and Pbx2 in 129 EpiSCs with a CRISPR/Cas9 approach. e Schematics of wild-type (WT) and Pbx-DKO EpiSCs differentiation towards PSM. The time-points selected for scRNA-seq analyses are highlighted in black. f Monocle’s pseudotemporal ordering of WT (black) and Pbx-DKO cells (yellow) spanning the NMP-to-PSM transition (24–48 h), showing inability to generate PSM and increased number of NMPs/MPCs caused by loss of PBX. g Pseudotime analysis of PSM differentiation showing distribution of WT (black) and Pbx-DKO cells (yellow) expressing the NMP genes Sox2 and T-Bra and the PSM marker Tbx6. h Representative immunofluorescence staining for T-BRA (white), SOX2 (red) and TBX6 (green) at 48 h of differentiation reveals an accumulation of NMPs (T-BRApos;SOX2pos, dashed white lines) in Pbx-DKO cells. Scale bar: 50 µm. i Histograms representing the percentage of progenitors in WT (black) and Pbx-DKO cells (yellow) at 48 h of differentiation. Upper panel: percentage of MPCs (T-BRApos;TBX6pos) relative to DAPIpos cells (total cells) or to TBX6pos cells (PSM). Lower panel: percentage of NMPs (T-BRApos;SOX2pos) and PSM (TBX6pos) cells relative to DAPIpos cells. Data are mean ± s.e.m. P-values indicated in the figure were calculated by two-tailed unpaired t-test (n = 3 biological replicates).

