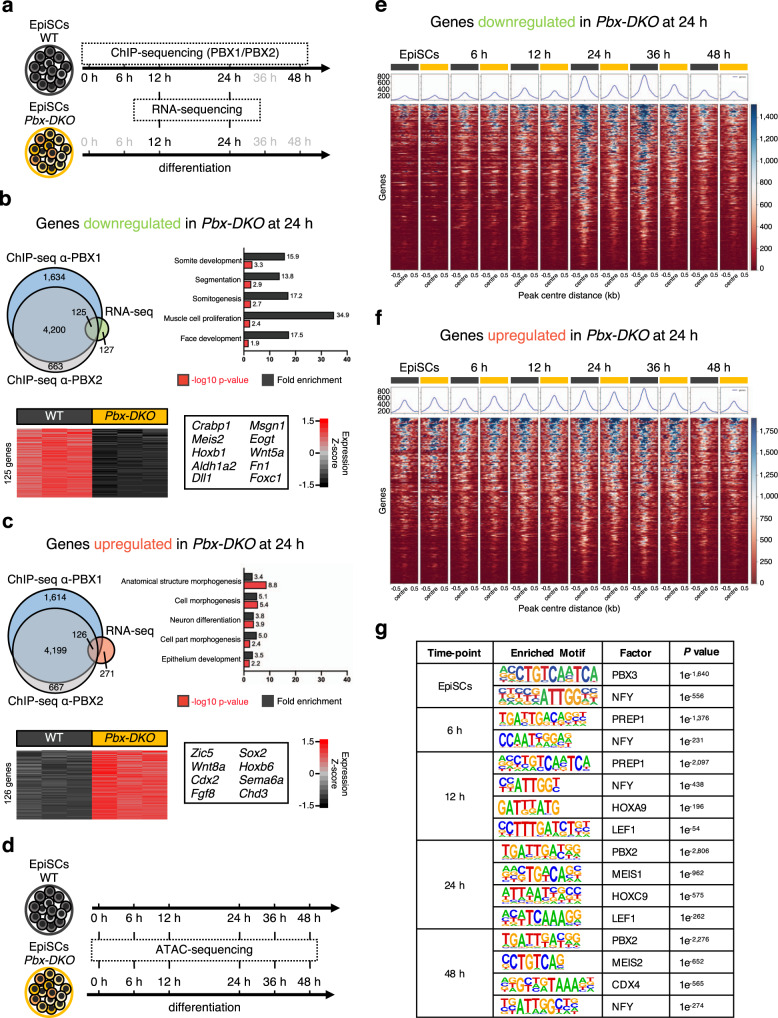
Fig. 4. PBX proteins occupy regulatory regions associated with PSM genes and remodel chromatin accessibility.
a Schematics of EpiSC differentiation towards PSM. The time-points selected for ChIP-seq/RNA-seq analyses are highlighted in black. b Top: overlap of downregulated genes in Pbx-DKO cells (RNA-seq) and genes associated with PBX-occupied regions at 24 h (ChIP-seq). GO-term enrichment analysis displays significant overrepresentation of terms associated with mesoderm and somite development (Binomial test with Bonferroni correction). Bottom: heatmap showing RNA-seq expression Z-scores computed for 125 downregulated PBX targets in Pbx-DKO (yellow) compared to WT cells (black). Representative markers are indicated. c Top: overlap of upregulated genes in Pbx-DKO cells (RNA-seq) associated with PBX-occupied regions (ChIP-seq) at 24 h. GO-term enrichment analysis shows correlation with terms associated with neurectoderm and embryonic development (Binomial test with Bonferroni correction). Bottom: heatmap displaying RNA-seq expression Z-scores computed for 126 upregulated PBX targets in Pbx-DKO (yellow) compared to WT cells (black). Representative markers are indicated. In b and c, significance was assessed by DEseq2 on the basis of two-sided Wald test with Benjamini–Hochberg adjusted P-values (P ≤ 0.05, fold-change ≥1.5). n = 3 biological replicates. d Schematics of EpiSC differentiation towards PSM illustrating the time-points selected for chromatin accessibility analysis (ATAC-seq). e Heatmap of chromatin accessibility of WT (black) and Pbx-DKO cells (yellow) at PBX-occupied regions that are associated with downregulated genes in Pbx-DKO along PSM differentiation, showing reduced accessibility in Pbx-DKO cells at 24 and 36 h. f Heatmap of chromatin accessibility at PBX-bound regions associated with upregulated genes in Pbx-DKO compared to WT cells. Chromatin accessibility is comparable between WT (black) and Pbx-DKO cells (yellow). The scale represents normalised counts (RPKM) for ATAC-seq peak signals ±500 bp around the centre of the peak in e and f. g Homer de novo motif analysis of 200 bp summit regions along differentiation reveals changing in binding sites enrichment at different time-points, highlighting the variety of PBX-binding partners during PSM differentiation. Only the most relevant binding motifs are shown for each time-point. See Supplementary Data 5 for the complete list.

