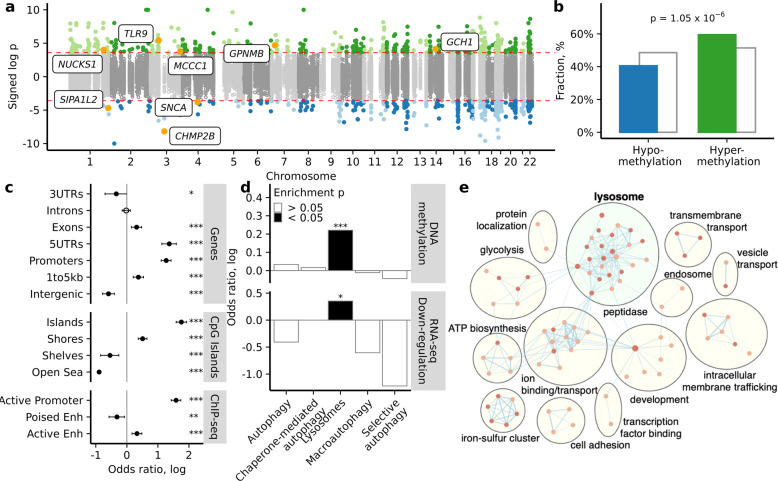
Fig. 1. Epigenetic dysregulation of the ALP in the PD appendix, particularly at lysosomal genes.
DNA methylation was fine-mapped at 521 genes in the ALP in the appendix of PD patients and controls (n = 24 and 19 individuals, respectively). a Manhattan plot demonstrating differential methylation in PD appendix. There were 326 genes in the ALP exhibiting differential methylation in PD relative to controls (928 cytosine sites at q < 0.05, robust linear regression). Highlighted are genes implicated in both our study and PD GWAS23. Signed log p refers to the significance of differentially methylated cytosines, with sign corresponding to the direction of DNA methylation change (hypermethylation, green or hypomethylated, blue). b Fraction of significantly hypomethylated (blue) and hypermethylated (green) sites in the PD appendix, as compared to all sites (gray). P-value represents two-sided Fisher’s exact test for enrichment of hypermethylated sites among significant versus non-significant cytosines. c Genomic elements enriched with significant differentially methylated sites in the PD appendix. Filled circles represent *p < 0.05, **p < 0.01, and ***p < 0.001, two-sided Fisher’s exact test on n = 182,024 cytosines comparing the odds of observing significant cytosines within versus outside of the genomic element. Error bars indicate 95% confidence intervals. d ALP pathways enriched with differential methylation and differential gene expression. Filled bars represent *p < 0.05 and ***p < 0.001, two-sided Fisher’s exact test comparing the odds of observing significant cytosines at genes belonging to the selected pathway versus the other targeted ALP genes. e Pathways affected by transcriptomic changes in the PD appendix. Pathways for the differentially expressed genes in the PD appendix were obtained using DAVID and visualized with EnrichmentMap and AutoAnnotate in Cytoscape (v3.7.1). Node colors represent normalized enrichment score, where darker red signifies greater enrichment. Actual p values are reported in Supplementary Data 21.

