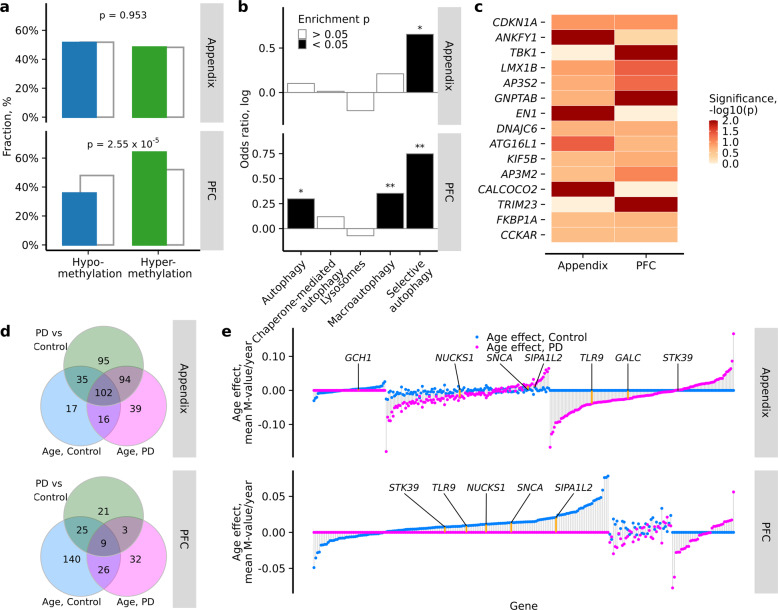
Fig. 4. Age-related changes in DNA methylation affecting ALP genes in the appendix and brain.
a Distribution of significantly hypomethylated (blue) and hypermethylated (green) cytosine sites in the healthy aging appendix and prefrontal cortex neurons, compared to all cytosine sites investigated (gray). P-values represent two-sided Fisher’s exact test for enrichment of hypermethylated sites among significant versus non-significant cytosines. b ALP pathways altered in the healthy aging appendix and prefrontal cortex neurons. Pathway enrichment for ALP genes with significant epigenetic aging changes in the healthy appendix (n = 51) and prefrontal cortex neurons (n = 42). Filled bars represent *p < 0.05 and **p < 0.01, two-sided Fisher’s exact test comparing the odds of observing significant cytosines at genes belonging to selected pathway versus the other targeted ALP genes. c Top 10 genes most consistently altered in the healthy aging appendix and neurons of the prefrontal cortex (determined by robust rank aggregation). P-value is ALP gene enrichment in differentially methylated cytosines determined by two-sided Fisher’s exact test. d Overlap of the ALP genes affected by mean methylation differences between control and PD samples or age-related methylation changes in healthy control or PD samples in the appendix (upper panel) and prefrontal cortex neurons (lower panel). A gene is affected if it has a significantly differentially modified cytosine (FDR q < 0.05). e Epigenetic aging rates of ALP genes in the appendix (upper panel) and prefrontal cortex neurons (lower panel) of healthy controls (blue points) and PD cases (purple points). For each ALP gene, the aging rate was computed as mean aging rate of cytosines pertaining to that gene weighted by log transformed p value of aging model fit. The aging rate was set to zero for ALP genes that did not have any aging cytosines with FDR q < 0.05. Genes were sorted by the sum of their aging rates in control and PD samples. PD-related genes implicated in GWAS studies are marked by orange segments and labeled. Appendix n = 51 controls, 24 PD; prefrontal cortex n = 42 controls, 52 PD. Actual p values are reported in Supplementary Data 21.

