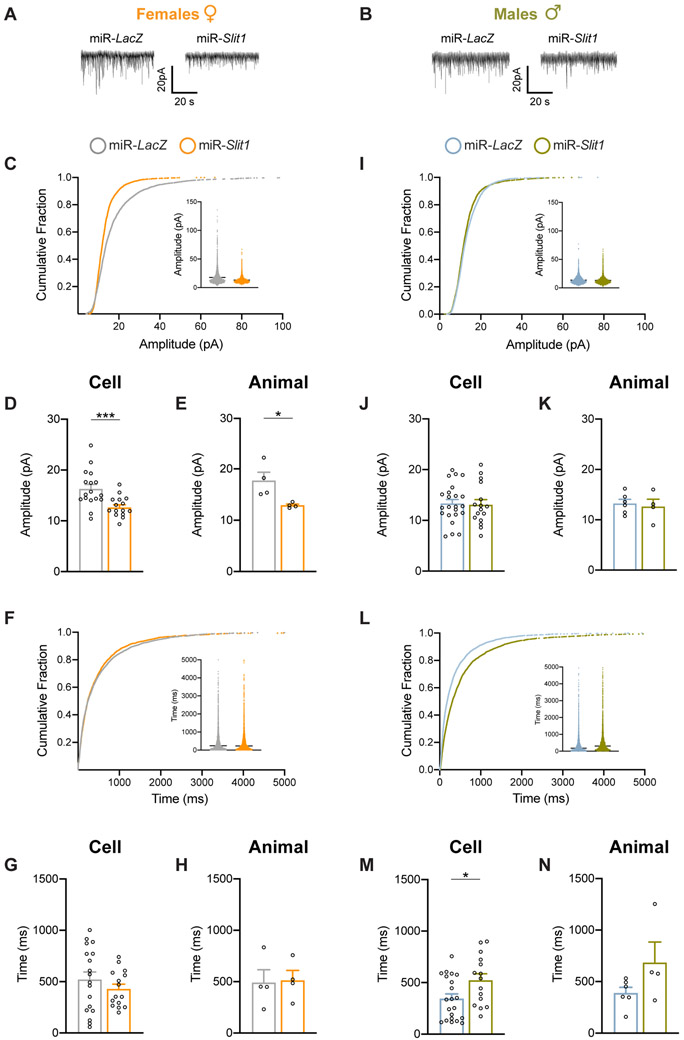
Figure 4. Slit1 KD modulates mEPSC amplitude in vmPFC pyramidal neurons of female mice.
(A, B) Representative membrane potential of pyramidal neurons in the vmPFC of female (A) or male (B) mice after Slit1 or LacZ KD. (C) Cumulative curves and scatter plots for mEPSC amplitude of female mice. (D, E) Bar graphs indicate that Slit1 KD decreased the amplitude of mEPSCs compared to miR-LacZ on a “per cell” (n=15-17 cells/group) (D) or “per animal” (n=4 animals/group) (E) basis. (F) Cumulative curves and scatter plots for mEPSC interevent interval of female mice. (G, H) Slit1 KD in females had no effect on mEPSC interevent interval per cell (G) or per animal (H). (I) Cumulative curves and scatter plots for mEPSC amplitude of male mice. (J, K) Slit1 KD in males had no effect on mEPSC amplitude per cell (J) or per animal (K). (L) Cumulative curves and scatter plots for mEPSC interevent interval of male mice. (M, N) Bar graphs indicate that Slit1 KD increased mEPSC interevent interval compared to miR-LacZ per cell (n=15-21 cells/group) (M), but not per animal (n=4-6 animals/group) (N). ***p<0.001.

