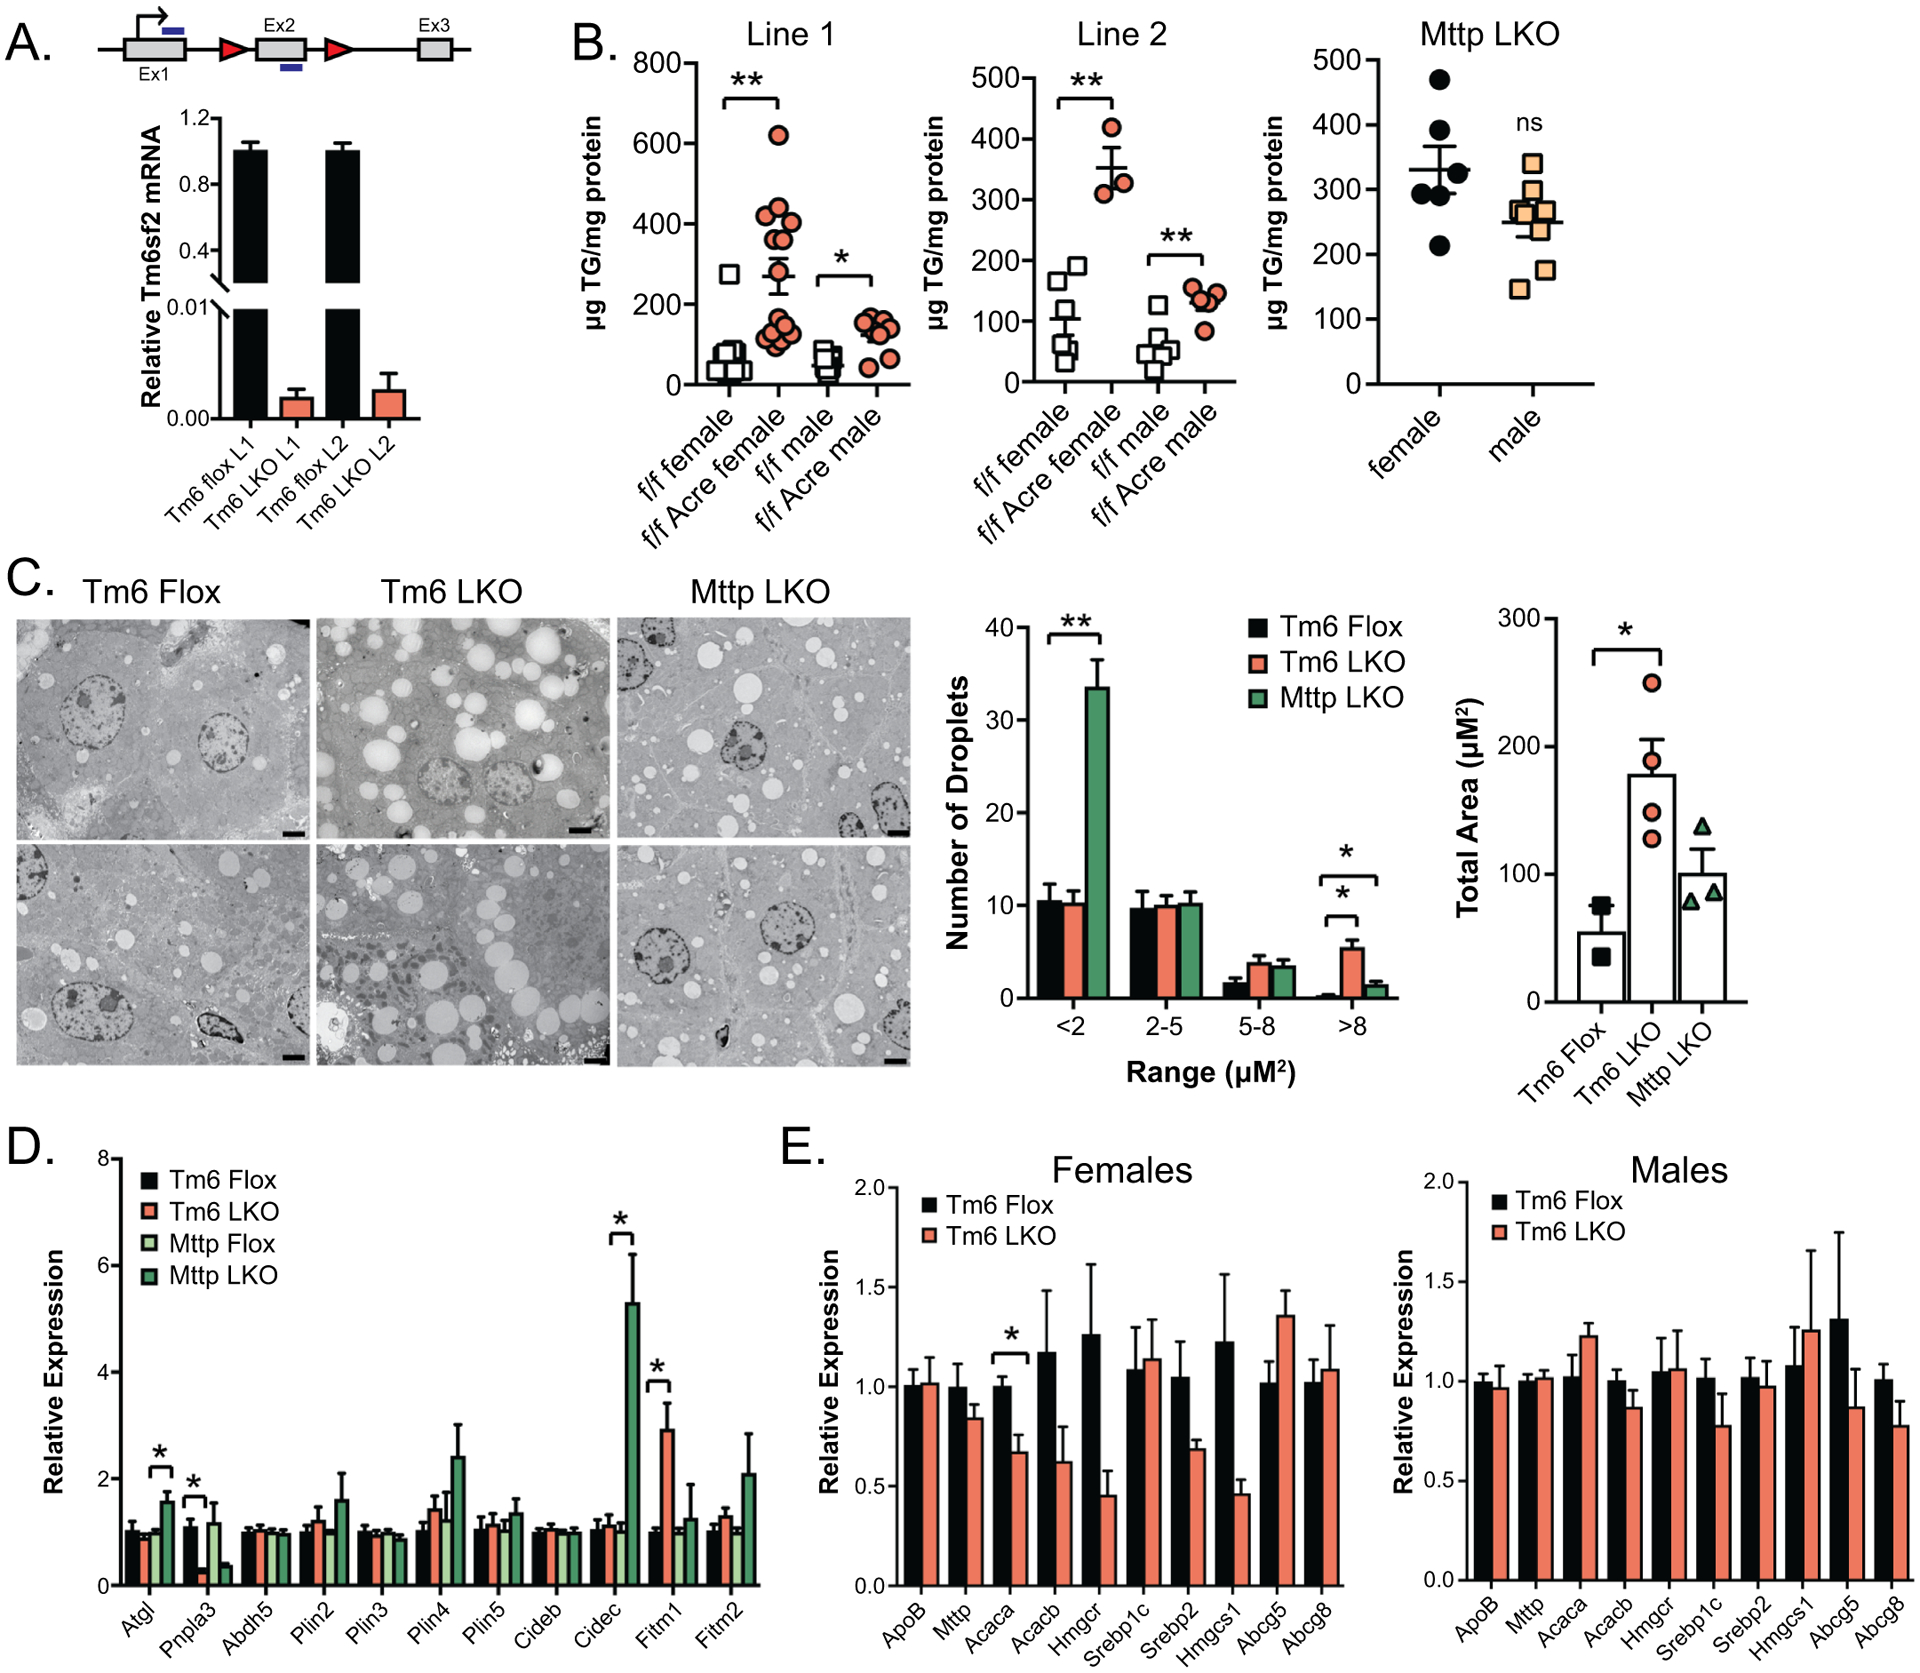
Figure 1:

Targeting strategy and baseline characterization of Tm6 LKO mice. A. Schematic diagram of Tm6sf2 gene showing the location of Lox P recombination sites (triangles) in intronic regions surrounding Exon 2 (Ex2). Also shown is the translation initiation site (arrow) and the location of primers used to detect Tm6sf2 mRNA (blue bars). Lower panel: Relative expression of Tm6sf2 mRNA in the liver of two distinct conditional knock out lines of Tm6 Flox and Tm6 LKO mice (L1, L2; n=5–7 females/group). B. Hepatic triglyceride levels in male and female, Tm6 flox and Tm6 LKO mice from 2 distinct Tm6sf2 LKO lines (left, middle). Right panel shows hepatic triglyceride levels in male and female Mttp LKO mice for comparison. All mice are 12–14 weeks of age, fed chow diet. C. Left: Representative TEM images of intracellular lipid droplets in chow fed Tm6 Flox, Tm6 LKO and Mttp LKO liver tissue (2000x, scale bar = 2μM). Middle: Quantitation of lipid droplet size distribution in Tm6 Flox (n=2), Tm6 LKO (n=4) and Mttp LKO (n=3) female mice (6 images/mouse). Right: Average total lipid droplet area in 6 images/animal. D. Relative gene expression of lipid droplet associated proteins in Tm6 Flox, Tm6 LKO, Mttp Flox and Mttp LKO liver (chow diet females, n=4/genotype), with expression normalized to respective flox control samples. E. Baseline expression of genes involved in TG secretion, fibrogenesis, and inflammation in male and female Tm6 LKO and control mice (n=5/genotype, 12–14 weeks, chow diet). For all panels, * indicates p<0.05, ** indicates p<0.01.
