
Figure 7.
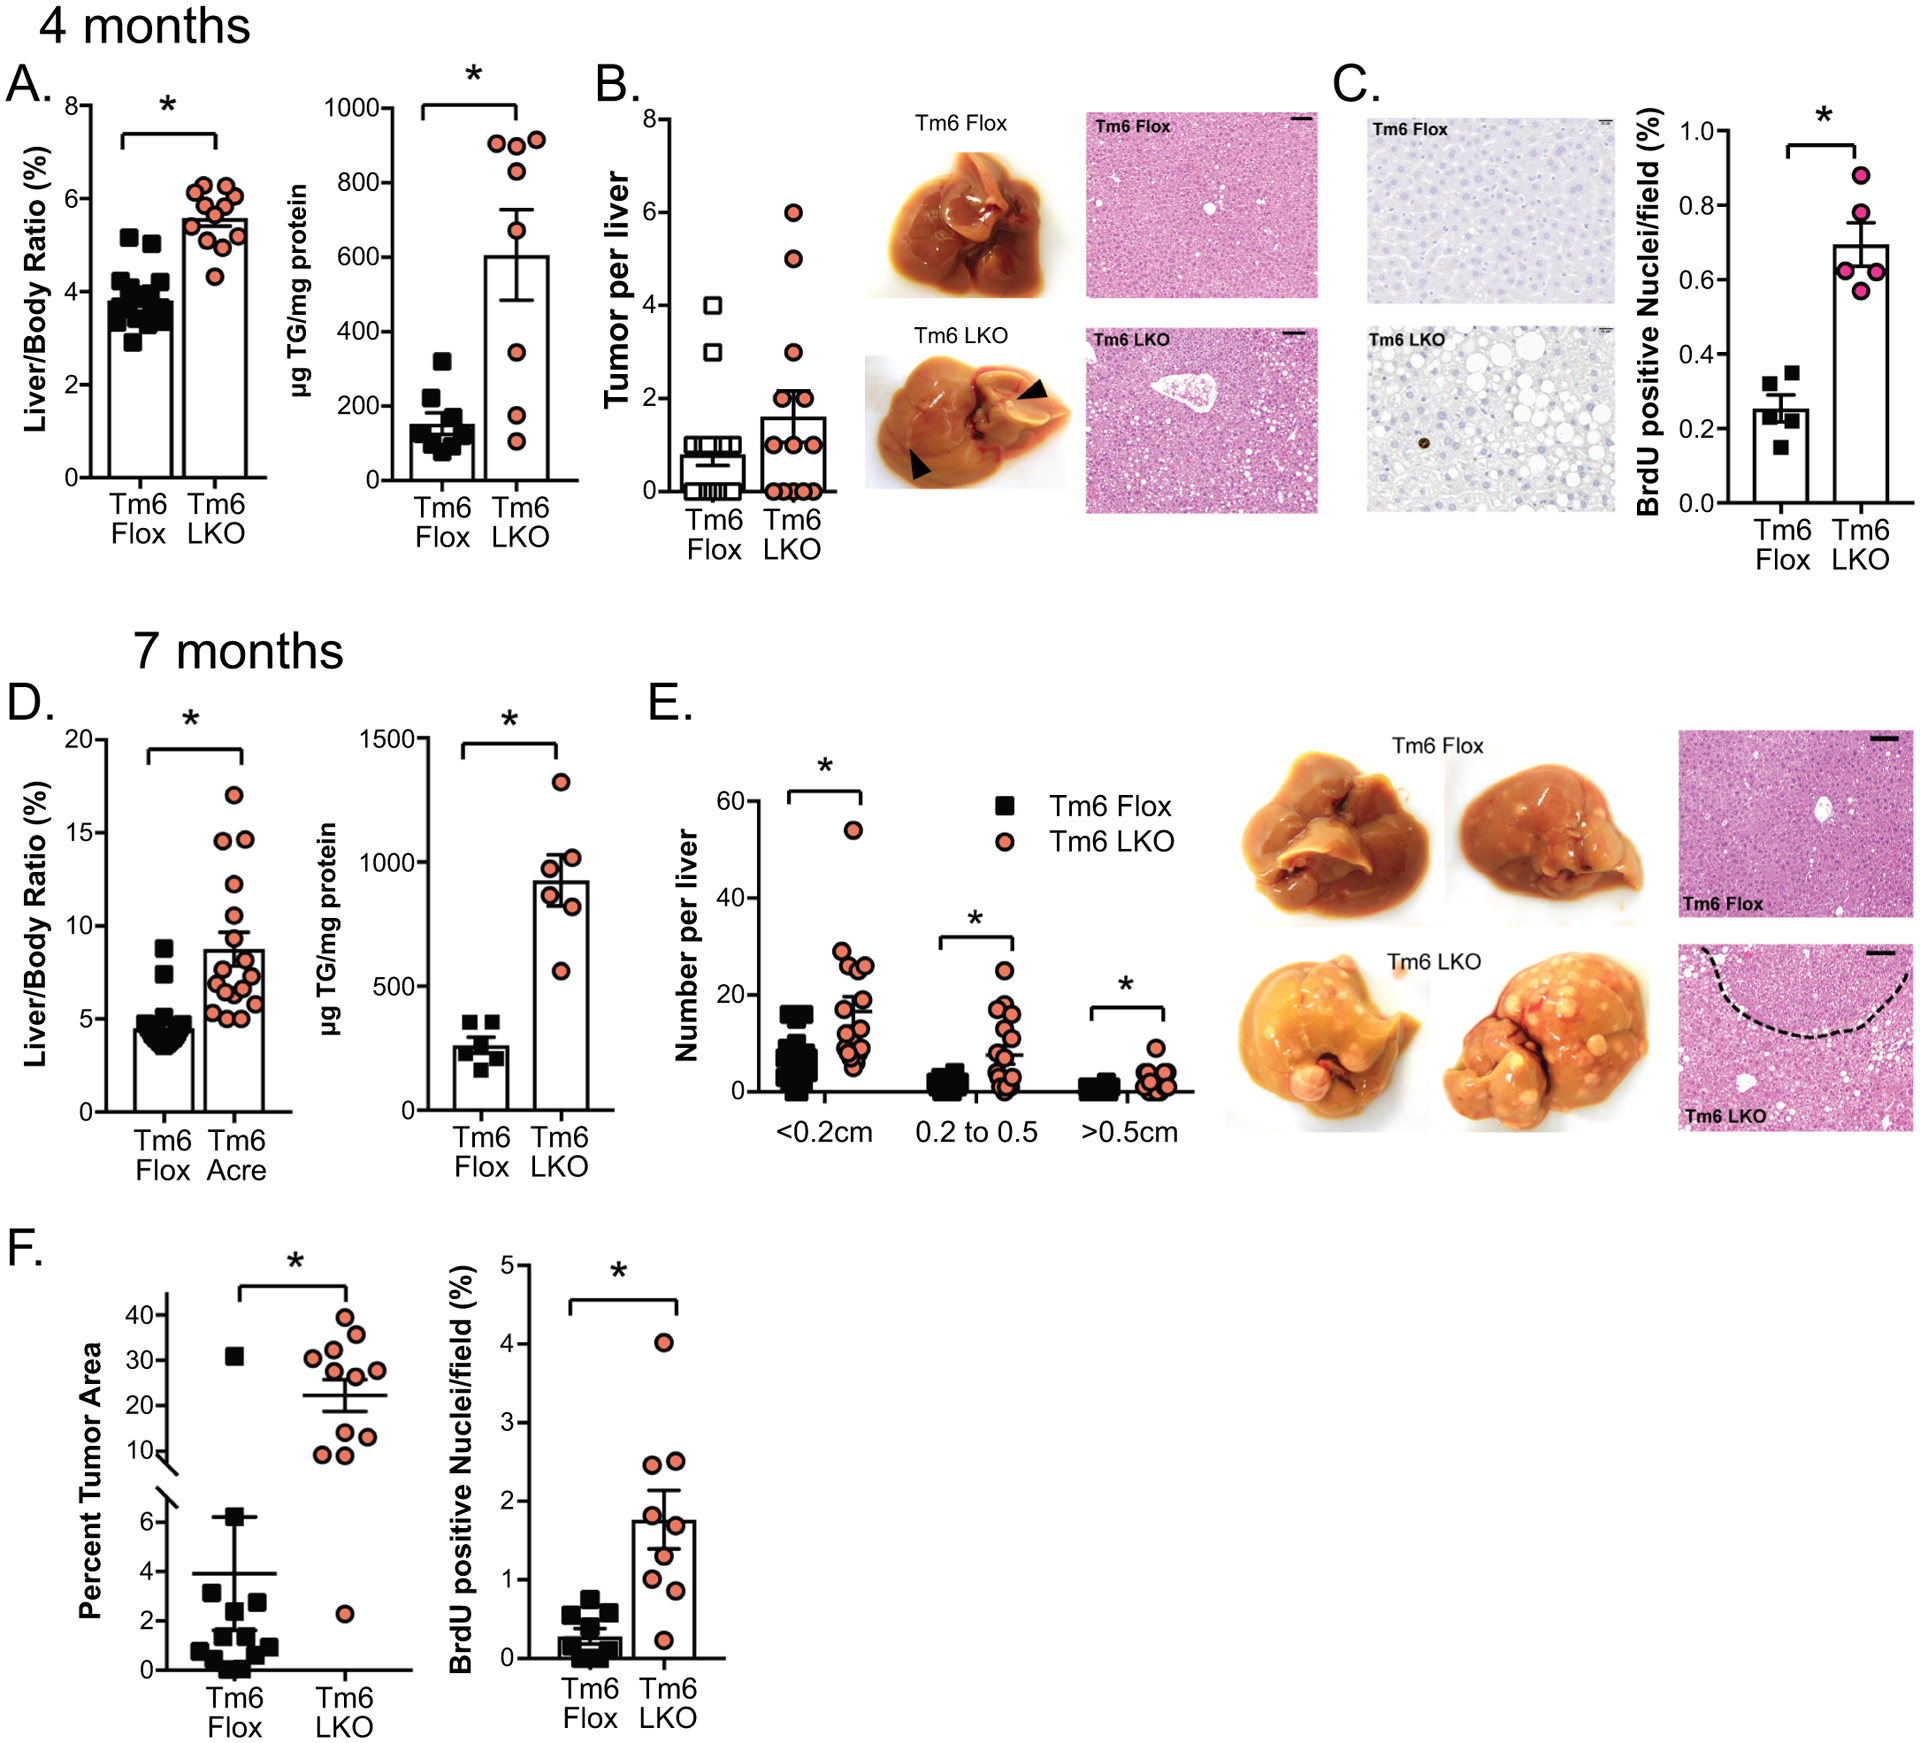
Effect of DEN induced tumorigenesis in Tm6 LKO mice. A. Liver size and triglyceride content in Tm6 Flox and Tm6 LKO mice in the DEN high fat diet model at 4 months of age (n=20 flox, 13 LKO for liver size; n=8/genotype for TG). B. Average number of visible tumors at 4 months (n=13–20/genotype), with representative livers and H&E images shown (100x, scale bar = 100μM). C. BrdU incorporation in liver tissue of DEN treated animals at 4 months. Left: BrdU images at 400x, scale bar=20μM. Right: Quantitation of BrdU positive hepatocytes, expressed as a percent of total hepatocyte nuclei per field. D. Liver size and triglyceride content of mice in DEN high fat model at 7 months of age (n=30 flox, 23 LKO for liver size; n=6/genotype for TG). E. Size distribution of visible tumors in DEN high fat mice at 7 months, with representative livers and H&E images shown (100x, scale bar=100μm). F. Quantitation of tumor area and BrdU positive nuclei in Tm6 Flox and Tm6 LKO mice in DEN high fat model at 7 months. For all panels, asterisks indicate p<0.05 vs controls.