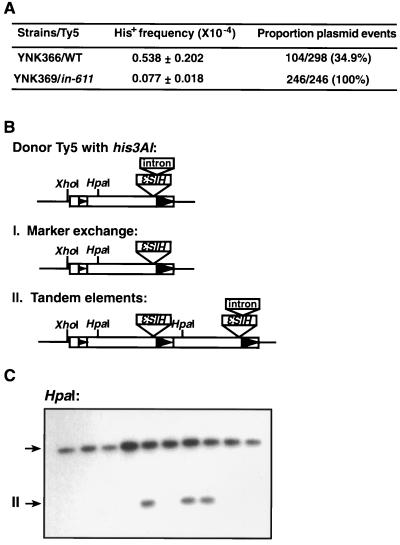
FIG. 3.
Structural analysis of recombination events generated by a Ty5 integrase mutant. (A) The overall His+ frequency and the proportion of recombination events are shown for the Ty5 integrase mutant and the wild-type Ty5 element. The data were determined by the assay shown in Fig. 1A. (B) Maps of Ty5 donor element and recombination products. The arrowheads represent LTRs. (C) Southern blot analysis of 10 individual His+ colonies generated by the Ty5 integrase mutant (in-611). The upper arrow indicates the restriction fragment of the donor Ty5 element. For lanes with a single hybridizing restriction fragment, this band represents the his3AI marker that has been converted by marker exchange to a functional HIS3 gene. The second hybridizing restriction fragment in some lanes (lower arrow, labeled “II”) is derived from tandem elements.

