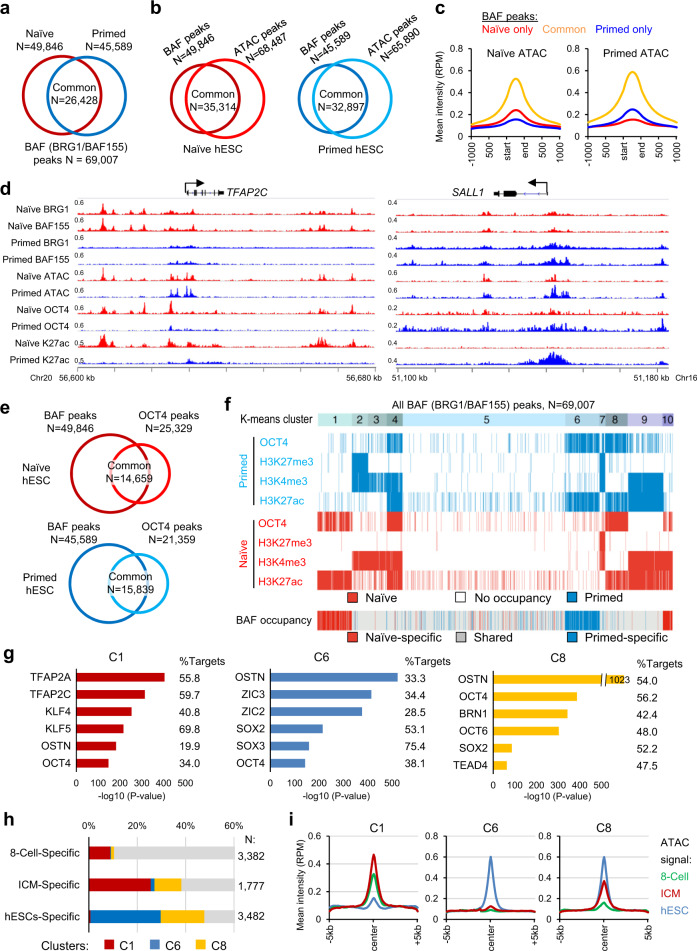
Fig. 3. Genome-wide binding profiles of OCT4 and BAF complexes shape the naïve- and primed-specific enhancer landscapes.
a Overlap of BAF (BRG1/BAF155) peaks in naïve and primed hESCs identified by ChIP-seq analysis. b Overlap of BAF and chromatin accessibility (ATAC-seq)48 peaks in naïve (left) and primed (right) hESCs. c Intensity plots of mean ATAC signals at naïve-only, primed-only, and common BAF peaks (shown in panel a) in naïve (left) and primed (right) hESCs. d ChIP-seq tracks of BAF155, BRG1, ATAC-seq, OCT4, and H3K27ac at the naïve-specific TFAP2C and primed-specific SALL1 loci. The two tracks of each factor between naïve and primed hESCs are normalized to the same RPM (reads per million) values. e Overlap of BAF (BRG1/BAF155) and OCT4 peaks in naïve (top) and primed (bottom) hESCs. f K-means clustering analysis of all BAF (N = 69,007) peaks (shown in panel a) in naïve and primed hESCs identified 10 clusters with distinct patterns of OCT4 and histone marks enrichment. g Highly enriched TF binding motifs in regions C1 (left), C6 (middle), and C10 (right) from clustering analysis (shown in panel f). OSTN: OCT4/SOX2/TCF/NANOG consensus motif80. h–i Overlap of 8-cell-specific, ICM-specific, and primed hESC-specific ATAC-seq peaks (h) and plots of mean ATAC intensity (i) at clusters C1, C6, and C8 peak regions. The stage-specific distal ATAC regions are from a recent study of chromatin accessibility in human preimplantation embryos53.

