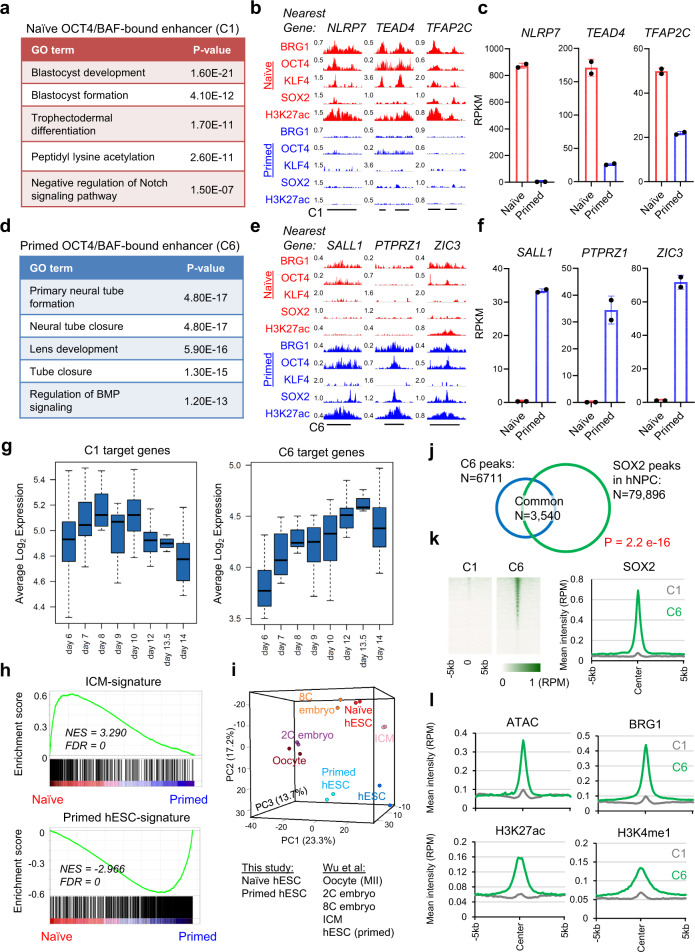
Fig. 5. Naïve and primed-specific enhancers drive expression of blastocyst and ectodermal lineage signatures, respectively.
a–c Gene ontology (GO) analysis (a), ChIP-seq tracks (b), and expression from RNA-seq analysis (c) of representative target genes (NLRP7, TEAD4, and TFAP2C) located nearby naïve-specific OCT4/BAF-bound enhancers (C1). d–f GO analysis (d), ChIP-seq tracks (e), and expression from RNA-seq analysis (f) of typical target genes (SALL1, PTPRZ1, and ZIC3) located nearby primed-specific OCT4/BAF-bound enhancers (C6). a, d P value is from the right-sided Fisher’s Extract test. c, f Data are presented as mean ± SD, obtained from n = 2 biologically independent experiments. g Expression of C1 and C6 target genes in a scRNA-seq analysis of epiblast cells in human embryos cultured in a 3D matrix between days 6 and 14 of development57. Boxplot presents the 25th, median, and 75th quartiles, and the whiskers extend 1.5 of interquartile ranges. h Geneset Enrichment Analysis (GSEA) for the terms “ICM-signature” and “Primed hESC-signature” in naïve versus primed hESCs used in this study. These signature genes were defined in a transcriptome study of human preimplantation embryos53. i Principal component analysis (PCA) of RNA-seq data from naïve and primed hESCs (this study) and distinct stages of human preimplantation development53. j Overlap of SOX2 peaks in human neural progenitor cells (hNPC)52 and primed-specific enhancer (C6) regions in hESCs. P value is from the right-sided Fisher’s Extract test. k Heatmaps and intensity plots of SOX2 ChIP-seq in hNPCs52 at naïve- (C1) and primed-specific (C6) enhancer regions. l Intensity plots of ATAC-seq, BRG1, and enhancer marks H3K27ac and H3K4me1 in hNPCs54 at naïve- (C1) and primed-specific (C6) enhancer regions.

