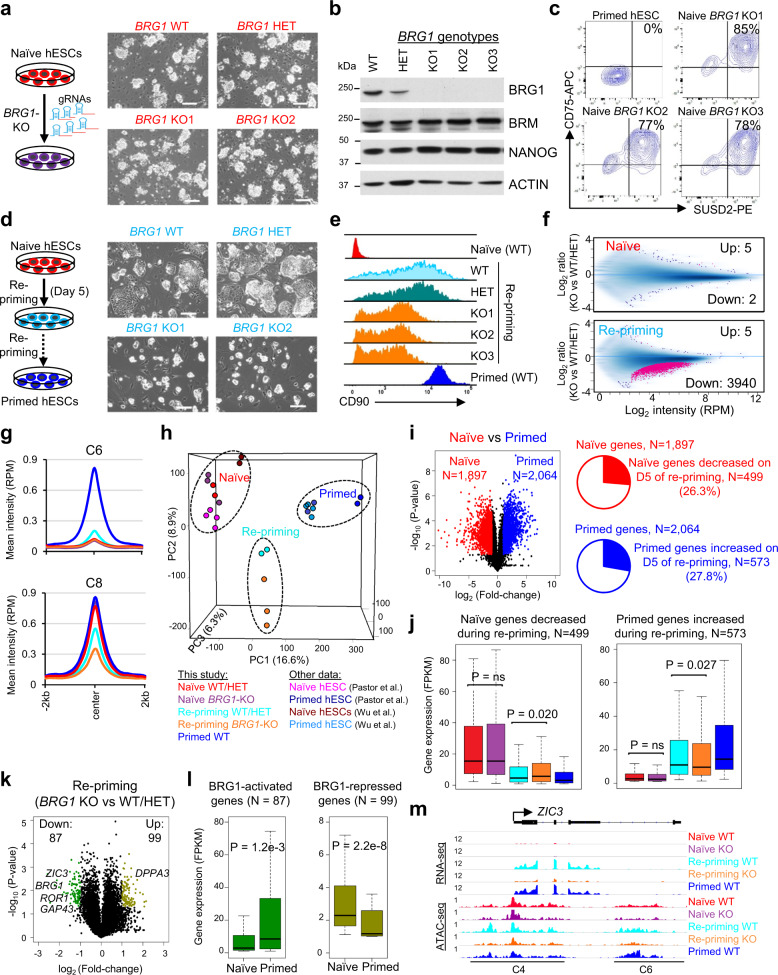
Fig. 7. BRG1 regulates chromatin accessibility during the exit from naïve pluripotency.
a Schematic overview of CRISPR/Cas9-mediated generation of BRG1 KO naïve hESCs and representative images. n = 3 independent BRG1 KO clones were generated. Scale bar is 200 μm. b Western blot analysis for BRG1, BRM, NANOG, and ACTIN in WT (BRG1+/+), HET (BRG1+/−), and KO (BRG1−/−) naïve hESCs (three independent clones). c Flow cytometry analysis for the naïve cell-surface markers CD75 and SUSD2 in primed hESCs and naïve BRG1 KO hESCs. n = 3 independent BRG1 KO clones were analyzed. d Schematic overview of the naïve-to-primed pluripotency transition and representative images with WT, BRG1+/−, and BRG1−/− cells on day 5 of repriming. Scale bar is 200 μm. e Histogram representing the mean fluorescence intensity (MFI) of CD90 cell-surface antibody staining in BRG1 WT, HET, and KO cells on d10 of repriming compared to naïve and primed hESCs. n = 3 independent BRG1 KO clones were analyzed. f Scatterplots showing the distribution of ATAC-seq peaks in BRG1 KO vs. WT/HET cells under naïve conditions (top) or on day 4 of repriming (bottom). Sites with significantly different ATAC intensities were determined by FDR < 0.05. g Mean ATAC-seq intensity at primed-specific (C6) and naïve-primed-shared (C8) enhancers of the BAF peaks during repriming in BRG1 KO vs. WT/HET cells. h Principal component analysis (PCA) of ATAC-seq profiles from BRG1 WT, HET, and KO cells under naïve conditions and during repriming compared to published ATAC-seq data of naïve and primed hESCs48,53. i Volcano plot (left) showing differentially expressed genes (fold change > 2, p value < 0.05, from unpaired two-sided t-test) between naïve and primed (WT) hESCs. Pie charts (right) for portions of naïve genes with decreased expression and primed genes with increased expression on day 5 repriming, compared with day 0 of naive cells. j Expression of the subsets of naïve genes decreased in repriming (left) and primed genes increased in repriming (right) from RNA-seq analysis of BRG1 WT/HET and KO cells under naïve, primed conditions, and during repriming. i, j Data are obtained from n = 3 biologically independent experiments. k Volcano plot showing differentially expressed genes between BRG1 KO and WT/HET naïve hESCs on day 5 of repriming. l Expression of BRG1-activated (N = 87) and -repressed (N = 99) genes on day 5 of repriming in naïve and primed hESCs. m RNA-seq and ATAC-seq tracks at the ZIC3 locus showing reduced expression and chromatin accessibility at enhancer and promoter regions in BRG1−/− cells during repriming. Boxplots (j, l) present the 25th, median, and 75th quartiles, and the whiskers extend to the 1.5 of interquartile ranges. P value is from two-sided Mann–Whitney test.

