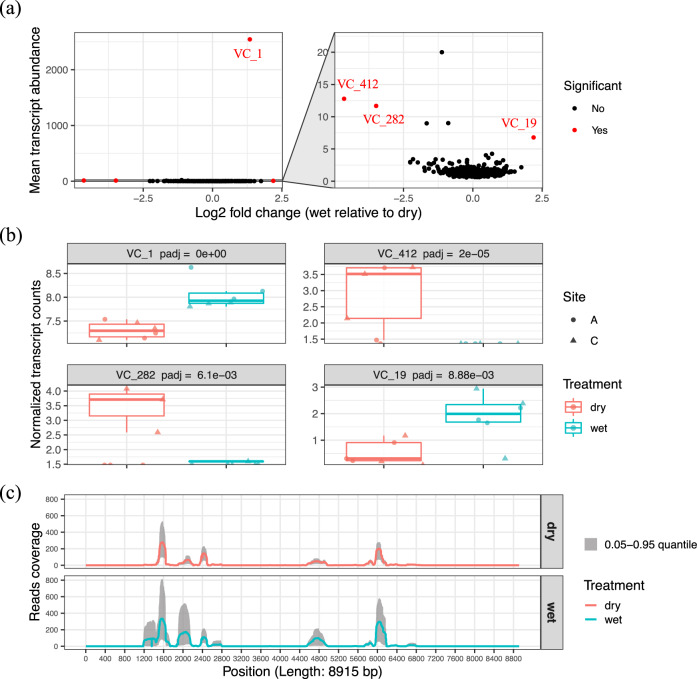
Fig. 2. DNA viral contigs with differential transcription in wet and dry soil treatments.
a Transcript abundance profiling of the identified DNA viral contigs. The mean transcript abundance of each DNA viral contig detected in all soils was plotted along the y axis in the sub-panel on the left. The normalized transcript abundances of each DNA viral contig were compared across treatments (wet and dry soils) and transformed into log2 fold change (wet relative to dry). The viral contigs with significantly differential transcript counts across treatments (p < 0.05) are highlighted in red in the sub-panel on the left. A zoomed-in panel on the right shows the viral contigs with lower transcript counts. b Four DNA viral contigs that were detected with differential transcript abundances in wet (blue) and dry (red) soils are shown. c Quality-filtered metatranscriptomic read coverage for the VC_1 sequence (total length of 8915 bp); the sequence with the highest number of transcripts mapped in (a). The solid line represents the mean read coverage per position detected in all replicates for each treatment (red = dry soil; blue = wet soil). The gray shading shows the range of read coverage distribution per position (0.05–0.95 quantile).

