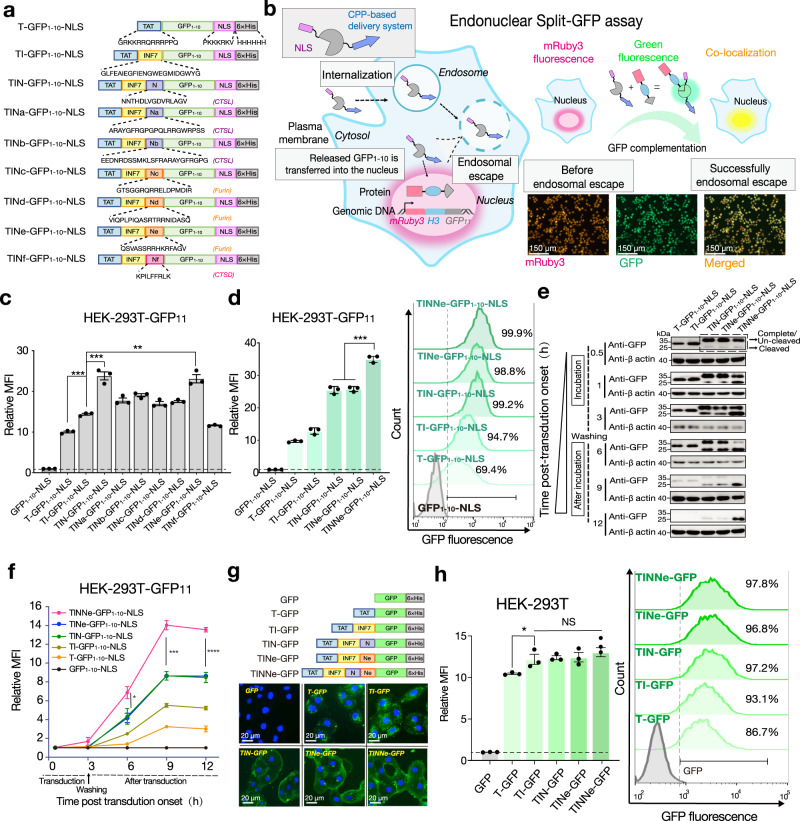
Fig. 1. Proteolytic removal of CPP-PMAP in endosomes enhances the escape efficiency of protein cargos.
a Schematic diagram of different GFP1–10-NLS-related recombinant proteins. The amino acid sequences of TAT, INF7, NLS, 6 × His and the different proteolytic cleavage sites (N and Na-Nf) are presented below, and each protease-recognised cleavage site is labelled in brackets. b Schematics of the endonuclear split GFP assay. Only after GFP1–10-NLS was released from the endosome and translocated into the nucleus of HEK-293T cells with stable expression of histone H3-GFP β-sheet 11 (HEK-293T GFP11), the fluorescence of the complete GFP in the nucleus observed, and co-localised with the mRuby3 fluorescence. c The MFI of HEK-293T GFP11 cells treated with GFP1–10-NLS-related proteins containing different cleavage sites (5 μM). d The MFI (left panel) within total HEK-293T cells and the corresponding percentage of green fluorescence-positive cells (right panel) treated with GFP1–10-NLS-related proteins containing two cleavage sites (5 μM). e Immunoblot analysis of GFP and f the MFI in the treated cells at different time points during the endonuclear split GFP assay (1 μM). g Representative microscopy images of cytosolic fluorescence distribution in MA-104 cells treated with different GFP-related proteins (1 μM) as indicated (upper panel: scheme diagram of GFP-related constructs). h The MFI (left panel) within total HEK-293T cells and the corresponding percentage of green fluorescence-positive cells (right panel) after treatment with GFP-related proteins (1 μM). For (c, d, f, and h) the results shown are the means ± s.e.m.; n = 3 biologically independent samples; *P < 0.05, **P < 0.01, ***P < 0.001, and NS no significant difference; two-tailed unpaired student’s t test. Relative MFI (fold increase) was obtained by MFI of total cells treated with the indicated proteins divided by that of total cells treated with the corresponding cargo protein only. For (b bottom panel) and (g bottom panel), the data shown are representative of three independent experiments, respectively; for (e), the data shown are representative of two independent experiments. For data, statistics, exact P values and uncropped images of the immunoblots, see Source Data File.

