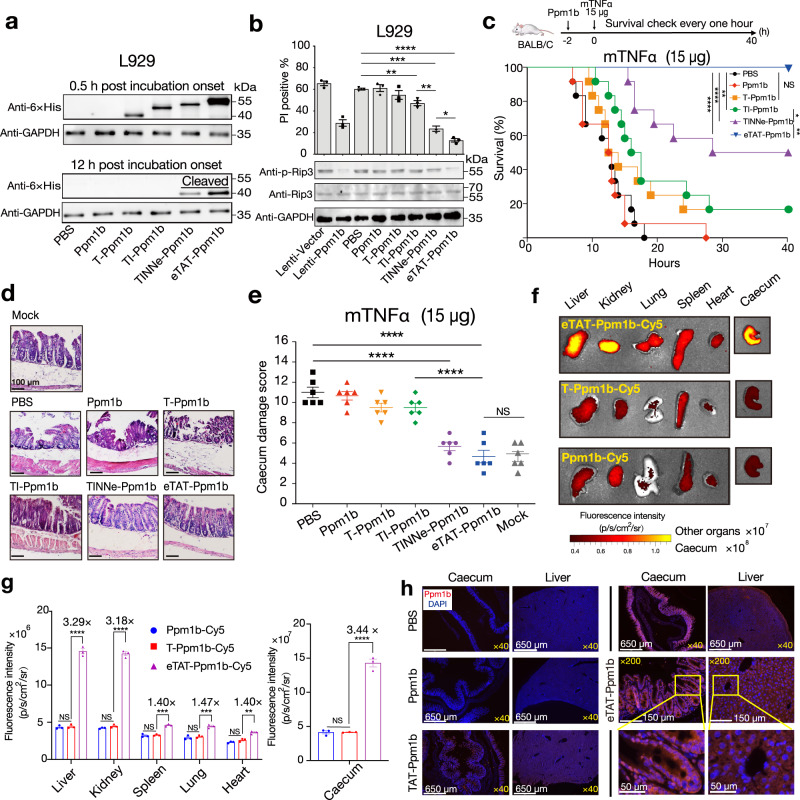
Fig. 3. eTAT-Ppm1b suppresses TNF-induced necroptosis in vitro and in vivo.
a Immunoblot analysis of the level of Ppm1b in L929 cells treated with Ppm1b-related proteins (1 μM) at the indicated time points. (n = 3). b TNF-induced necroptosis of L929 cells pretreated with lentivirus harbouring the Ppm1b gene or Ppm1b-related recombinant proteins. Pretreated cells were stimulated with mTNF + zVAD for 5 h, washed and collected. The number of dead cells was analysed by flow cytometry using PI (upper panel), and the levels of Rip3 and phosphorylated Rip3 (p-Rip3) were analysed by immunoblotting using the indicated antibody (bottom panel); n = 3 biologically independent samples. c–e TNF challenge of female BALB/c mice pretreated intravenously with different Ppm1b-related recombinant proteins. The mouse survival curves after TNF challenge (c). Mouse survival was monitored every hour for 40 h with the results presented in a Kaplan–Meier plot, and a log-rank (Mantel-Cox) test was performed; *P < 0.05, **P < 0.01, ***P < 0.001, ****P < 0.0001, and NS no significant difference; n = 12 mice for each group pooled from two independent experiments. Histopathological appearance of the mouse caecum (d). Six hours post-TNF challenge, the caecum was collected, sectioned and stained with H&E. Representative images are shown, and the scale bar is 100 μm. Caecum damage score for the different groups (e). For (d and e) 6 mice from each group were analysed. PBS-pretreated mice served as a negative control, and mock mice were not challenged with TNF. f, g Distribution of intravenously administered Cy5 labelled-Ppm1b-related proteins in female BALB/c mice. Representative microscope images (f) and florescence intensity (g) in the indicated organs of BALB/c mice intravenously administered Ppm1b-Cy5, TAT-Ppm1b-Cy5 or eTAT-Ppm1b-Cy5 (n = 3). Twenty-four hours post-administration, the mice were sacrificed, and fluorescence imaging of each organ was performed. h Five hours after injection with the indicated constructs or PBS, the tissues were harvested and prepared as paraffin slides. The nuclei were stained with DAPI, and the delivered Ppm1b was detected using anti-6 × His IgG as the primary antibody and Alexa 647-conjugated anti-mouse IgG as the secondary antibody. Fluorescence was captured via fluorescence microscopy. Yellow boxes in the images indicate magnified regions; the data shown are representative of three independent experiments. The data in (b top panel, e and g) are expressed as the means ± s.e.m; two-tailed unpaired student’s t test; *P < 0.05, **P < 0.01, ***P < 0.001, ****P < 0.0001, and NS no significant difference. For data, statistics, exact P values, and uncropped images of the immunoblots, see Source Data File.

