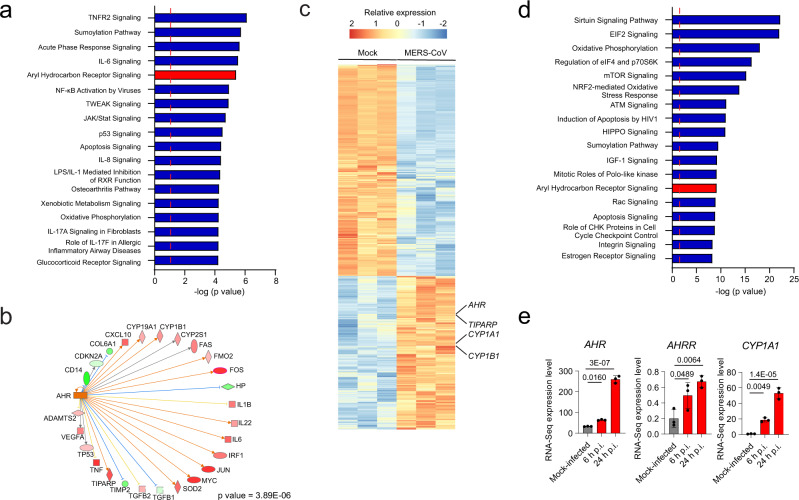
Fig. 1. AHR signaling is triggered in response to infection with multiple CoVs.
a IPA of pathways enriched in HCoV-229E-infected cells compared to mock-infected human lung adenocarcionma (A549) cells (n = 3 independent experiments per condition). Dashed red line indicates p = 0.05. p values were determined using a right-tailed Fisher’s exact test. b IPA Upstream regulator analysis identified AHR as a transcriptional regulator of the gene expression in response to HCoV-229E infection. p value was determined using a right-tailed Fisher’s exact test. Genes are represented as nodes. The shape of a node indicates the protein main function according to IPA. The color of the nodes represents expression levels: upregulated genes are shown in red and down-regulated genes are shown in green. The color of the lines indicates the predicted directional effect between two molecules. An orange line indicates a predicted upregulation, a blue line indicates a predicted downregulation and a yellow line indicates inconsistent findings. c Heatmap showing gene expression detected by RNA-seq analysis of mock-infected and MERS-CoV-infected human lung adenocarcinoma (Calu-3) cells (n = 3 independent experiments per condition). d IPA of pathways enriched in MERS-CoV-infected cells compared to mock-infected cells (n = 3 independent experiments per condition). Dashed red line indicates p = 0.05. p values were determined using a right-tailed Fisher’s exact test. e mRNA expression levels of AHR, AHRR, and CYP1A1 determined at different times post-infection by RNA-Seq. Data represent the mean ± SD (n = 3 independent experiments). p values were determined by a one-way ANOVA followed by Dunnet’s post-hoc test. Source data are provided as a Source Data file. p.i.: post-infection.

