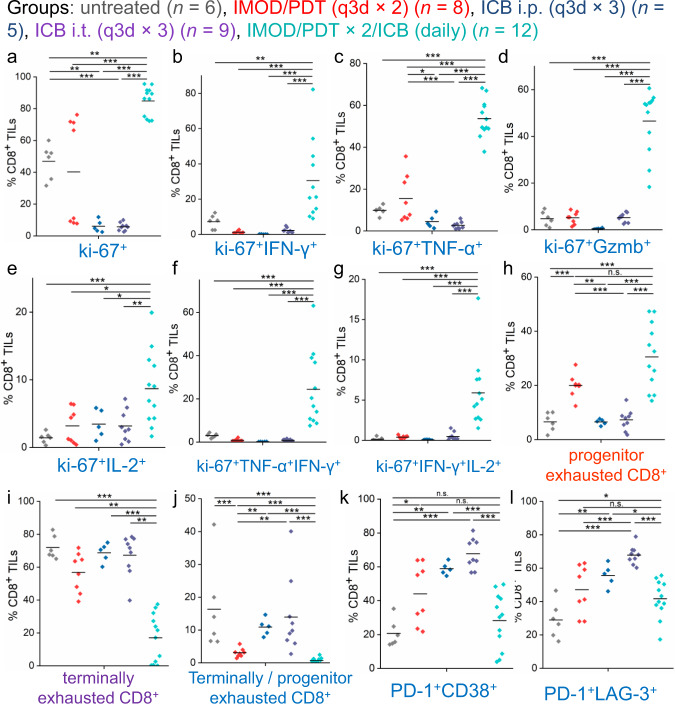
Fig. 7. Analysis of CD8+ TIL subsets that responded to combination therapy administered via IMOD in the treatment of E0771 tumors.
The panels show data for E0771 tumors (n = 5–12) in C57BL/6 mice receiving different treatments. a Frequencies of proliferative cells (ki-67+) in isolated CD8+ TILs. b–g Frequencies of cytokine production in isolated CD8+ TILs after ex vivo stimulation. The graphs depict frequencies of proliferative (b) ki-67+IFN-γ+, (c) ki-67+TNF-α+, (d) ki-67+Gzmb+, (e) ki-67+IL-2+, and polyfunctional sets of (f) ki-67+TNF-α+IFN-γ+, and (g) ki-67+IFN-γ+IL-2+ cells in isolated CD8+ TILs. h, i Frequencies of progenitor (h) and terminally (i) exhausted CD8+ cells in isolated CD8+ TILs. j The ratio between terminally and progenitor exhausted CD8+ TILs. k Frequencies of PD-1+CD38+ cells in CD8+ TILs. l Frequencies of PD-1+LAG-3+ cells in CD8+ TILs. Statistical significance is determined by Mann–Whitney U-tests. *P < 0.05, **P < 0.01, ***P < 0.001. Source data and P values are provided in the Source data file.

