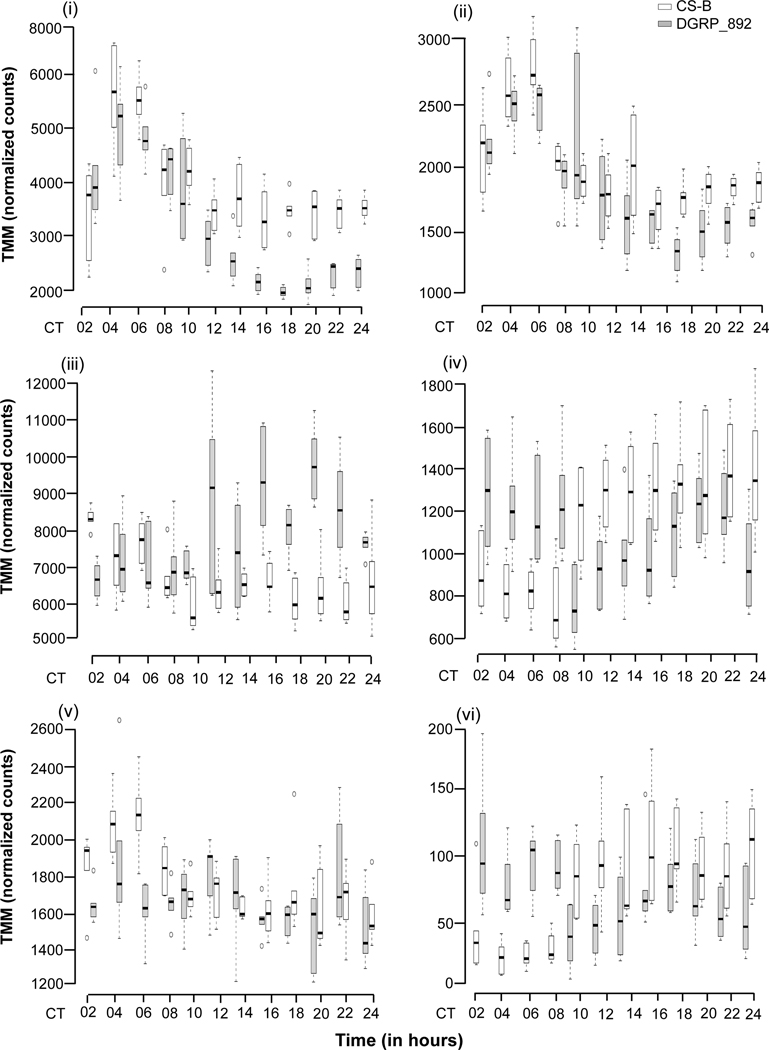
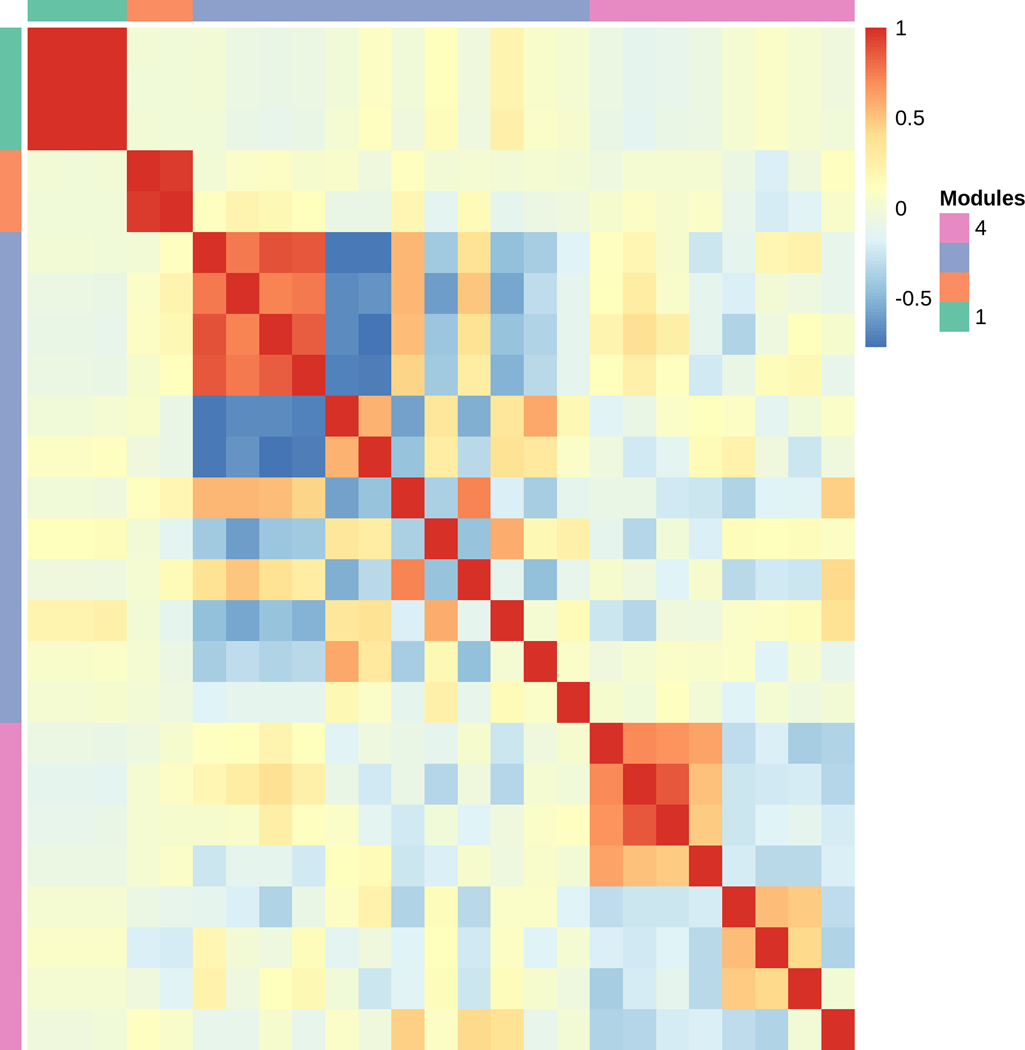
Figure 4.
Genes with a significant Genotype × Time interaction. (a) Representative boxplots of TMM-normalized gene expression for (i) gol, (ii) Usp8, (iii) Rh5, (iv) Cyp6a21, (v) Dnr1, and (vi) CG33965 are plotted against time point for DGRP_892 (gray boxes) and CSB (white boxes). CT denotes circadian time in constant darkness. (b) Plot of modules identified using Modulated Modularity Clustering. Each square in the plot represents the correlation between two genes; all 27 genes are shown in the plot. The red-white-blue scale bar shows ranges from high positive correlation (1.0, red) to high negative correlation (−1.0, blue). Colored bars demarcate the boundary of each module. Clusters of genes (modules) range from the most highly interconnected (upper left) to the least interconnected (lower right).


