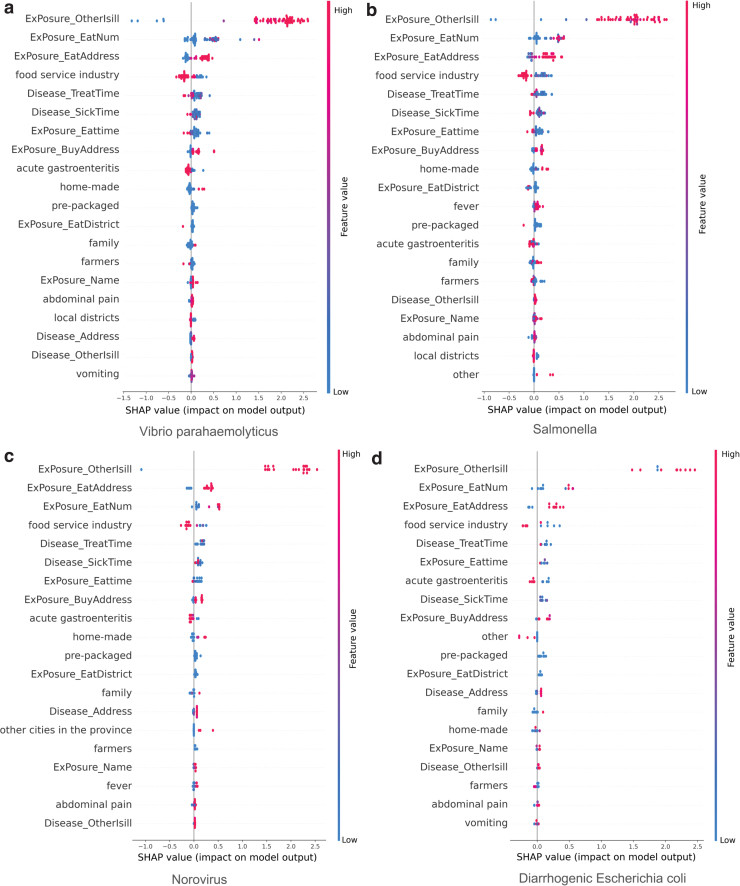
FIG. 3.
Impact of features on the XGBoost model output in outbreaks caused by Vibrio parahaemolyticus (a), Salmonella (b), Norovirus (c), and diarrheagenic Escherichia coli (d). In the analysis of pathogenic bacteria, the SHAP value is used as an indicator to measure the importance of features. The figure shows the top 20 features that play a decisive role in model classification. The ordinate is the name of the feature, and the abscissa is the size of the SHAP value. The larger the value, the greater the positive influence on the model output; and the smaller the value, the greater the negative influence on the model. All data sample points are displayed in the figure for each feature dimension; therefore, the distribution of data points under a certain feature can be seen in the figure. The different colors represent the value of the feature and size of the feature value. For example, if the feature ExPosure_Otherisill of a sample point has a large value, it means that this feature has a positive effect on judging a suspected outbreak as a real outbreak. SHAP, SHapley Additive exPlanation; XGBoost, eXtreme Gradient Boosting. Color images are available online.

