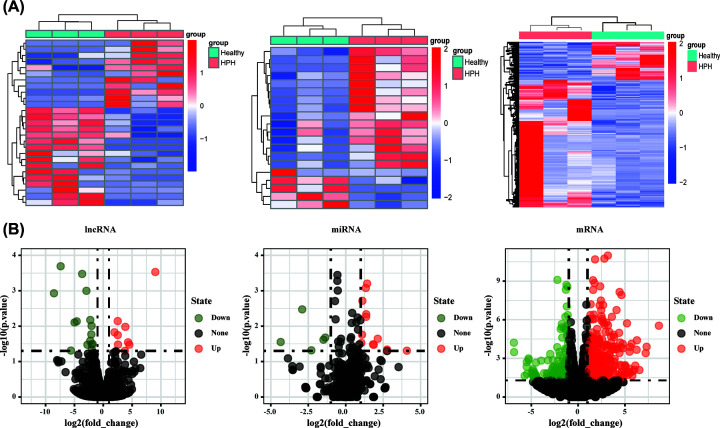
Figure 2. Identification of the differentially expressed (DE) genes in the HPH rat model.
(A) Heatmaps for the DE lncRNAs, DE miRNAs and DE mRNAs. Up-regulated genes are shown in red, and down-regulated genes are shown in green. (B) Volcano plots of the DE lncRNAs, DE miRNAs and DE mRNAs. The red, blue and black dots represent genes that are up-regulated, down-regulated and not significantly differentially expressed, respectively.

